This dataset contains mapped point locations for protected areas within Vanuatu. This dataset should be viewed in combination with the World Database on Protected Areas polygon locations to get a comprehensive view of all protected areas within Vanuatu.
This dataset contains mapped polygon locations for protected areas within Vanuatu. This dataset should be viewed in combination with the World Database on Protected Areas point locations to get a comprehensive view of all protected areas within Vanuatu.
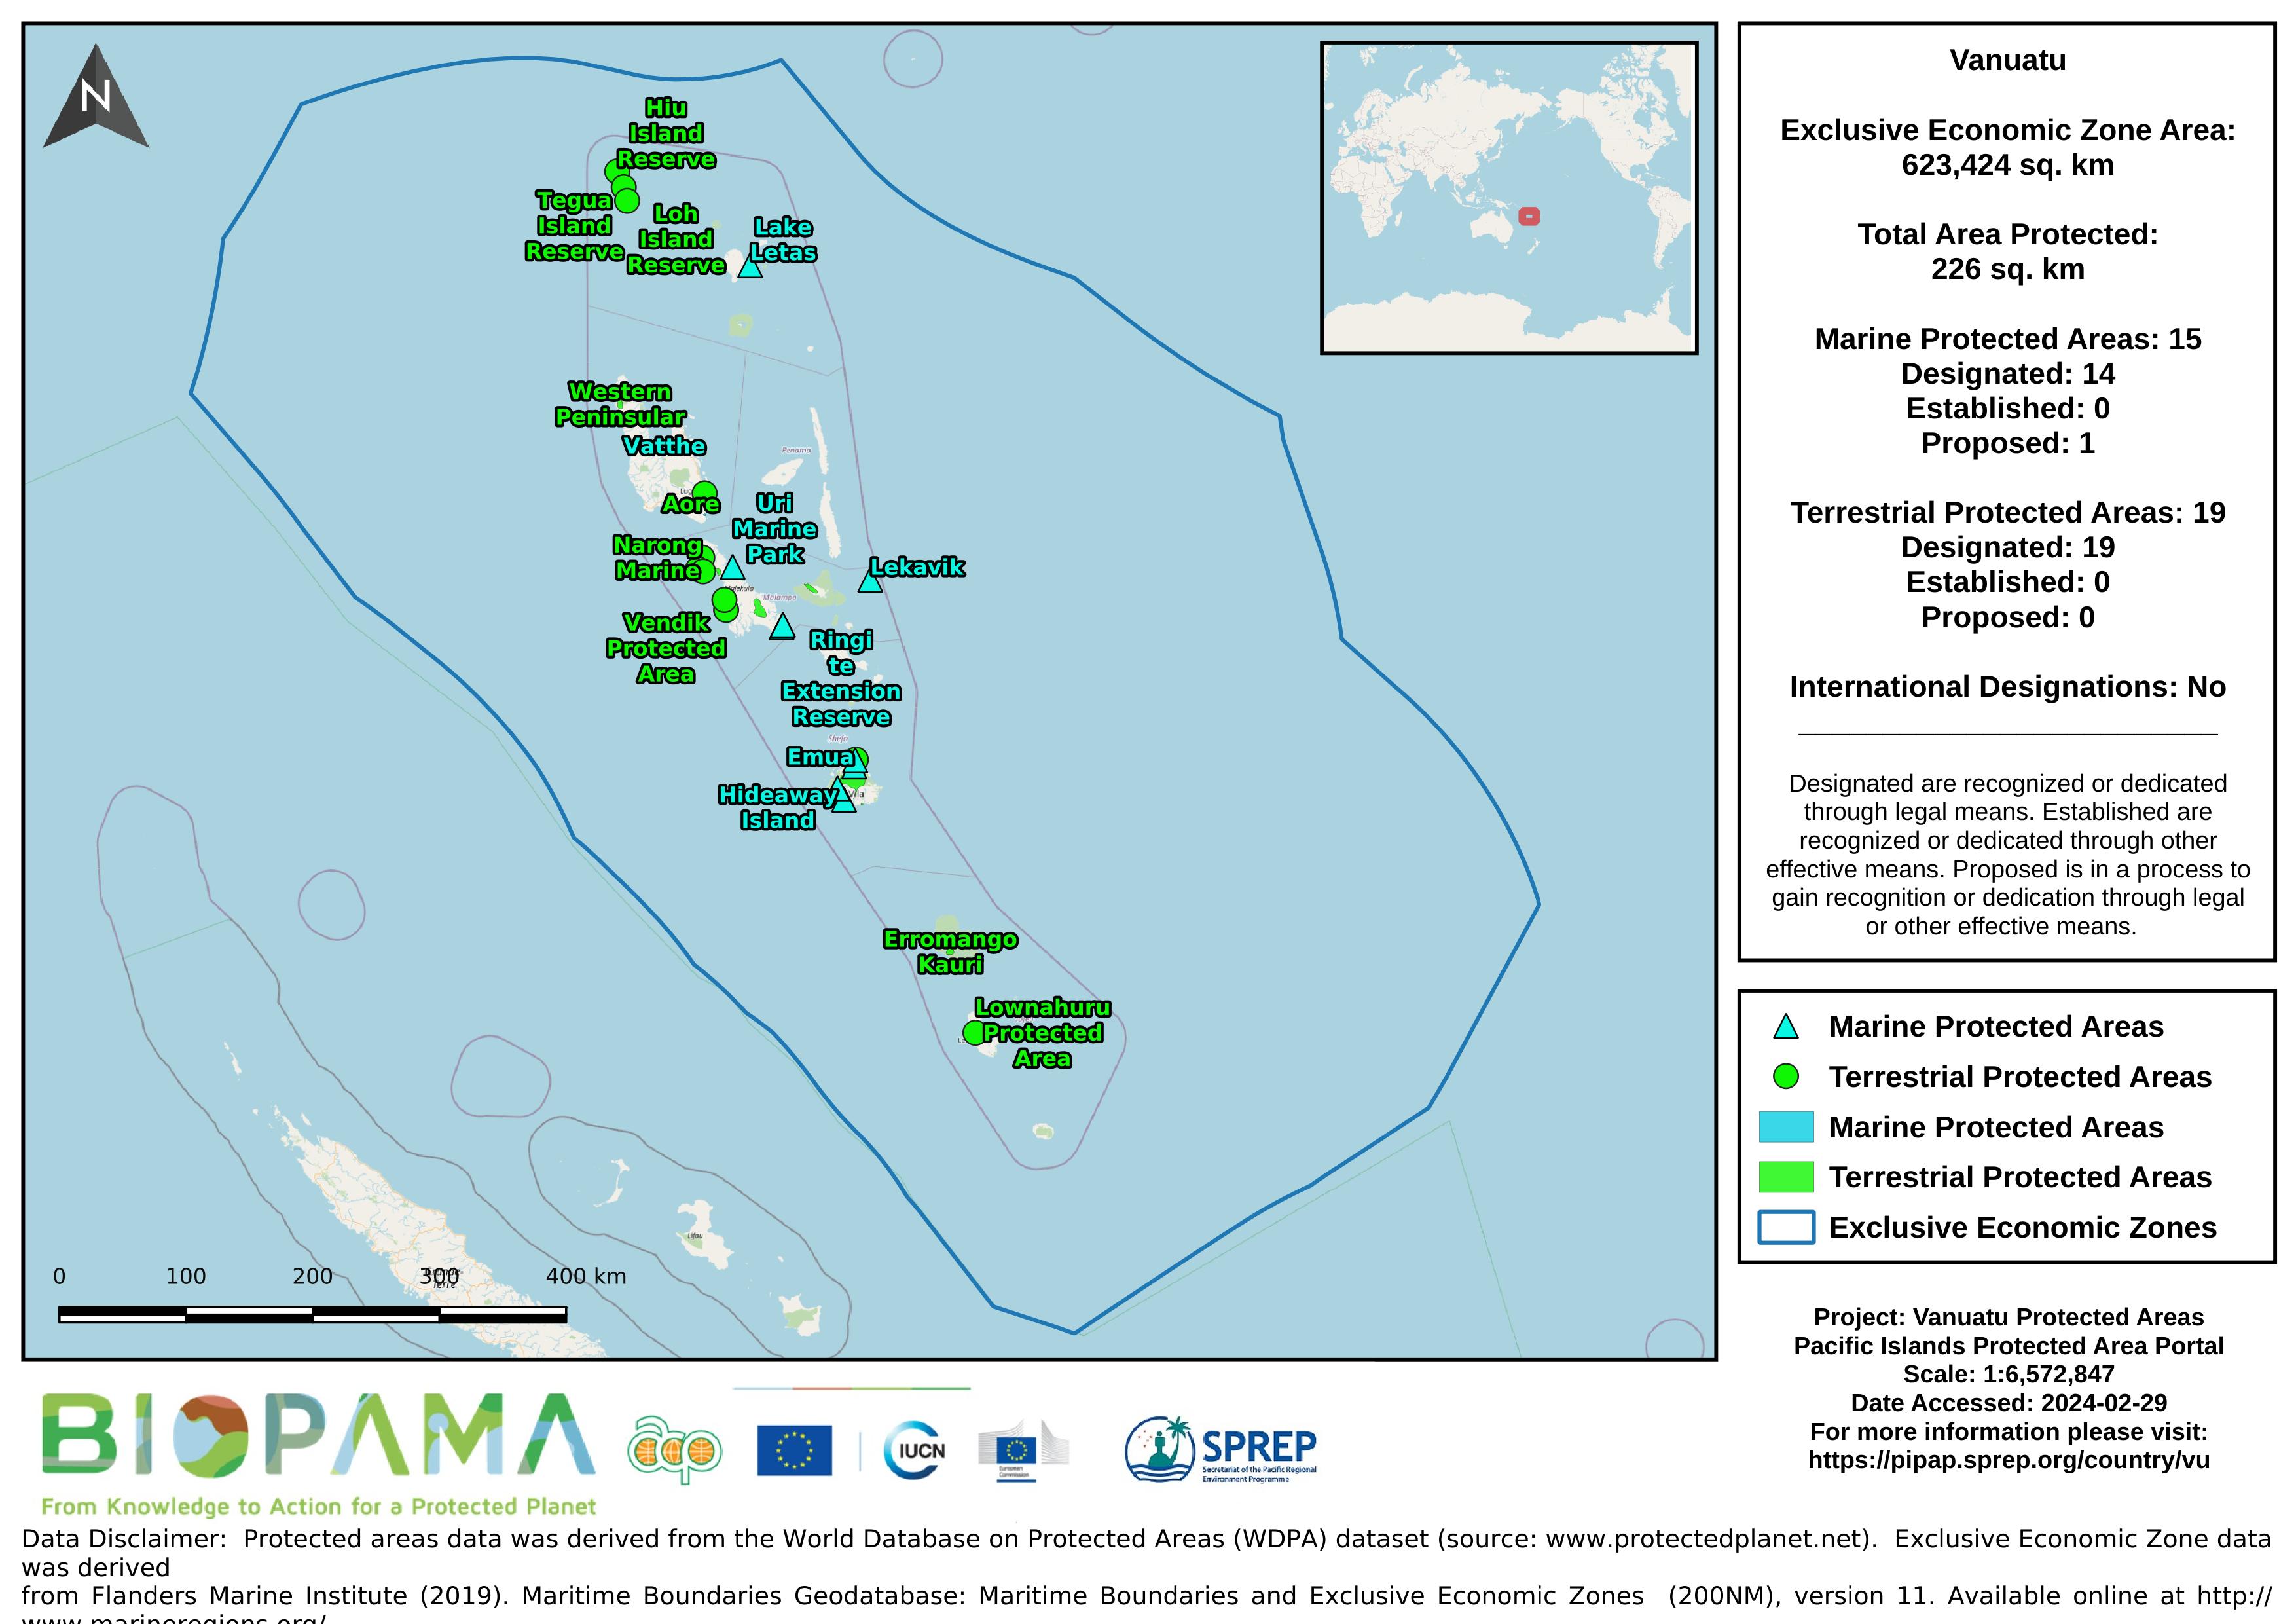
Map of the protected areas for Vanuatu with country-level summary statistics on the amount of area under protection, count for each type of protected area (terrestrial or marine), and the count of their designation.
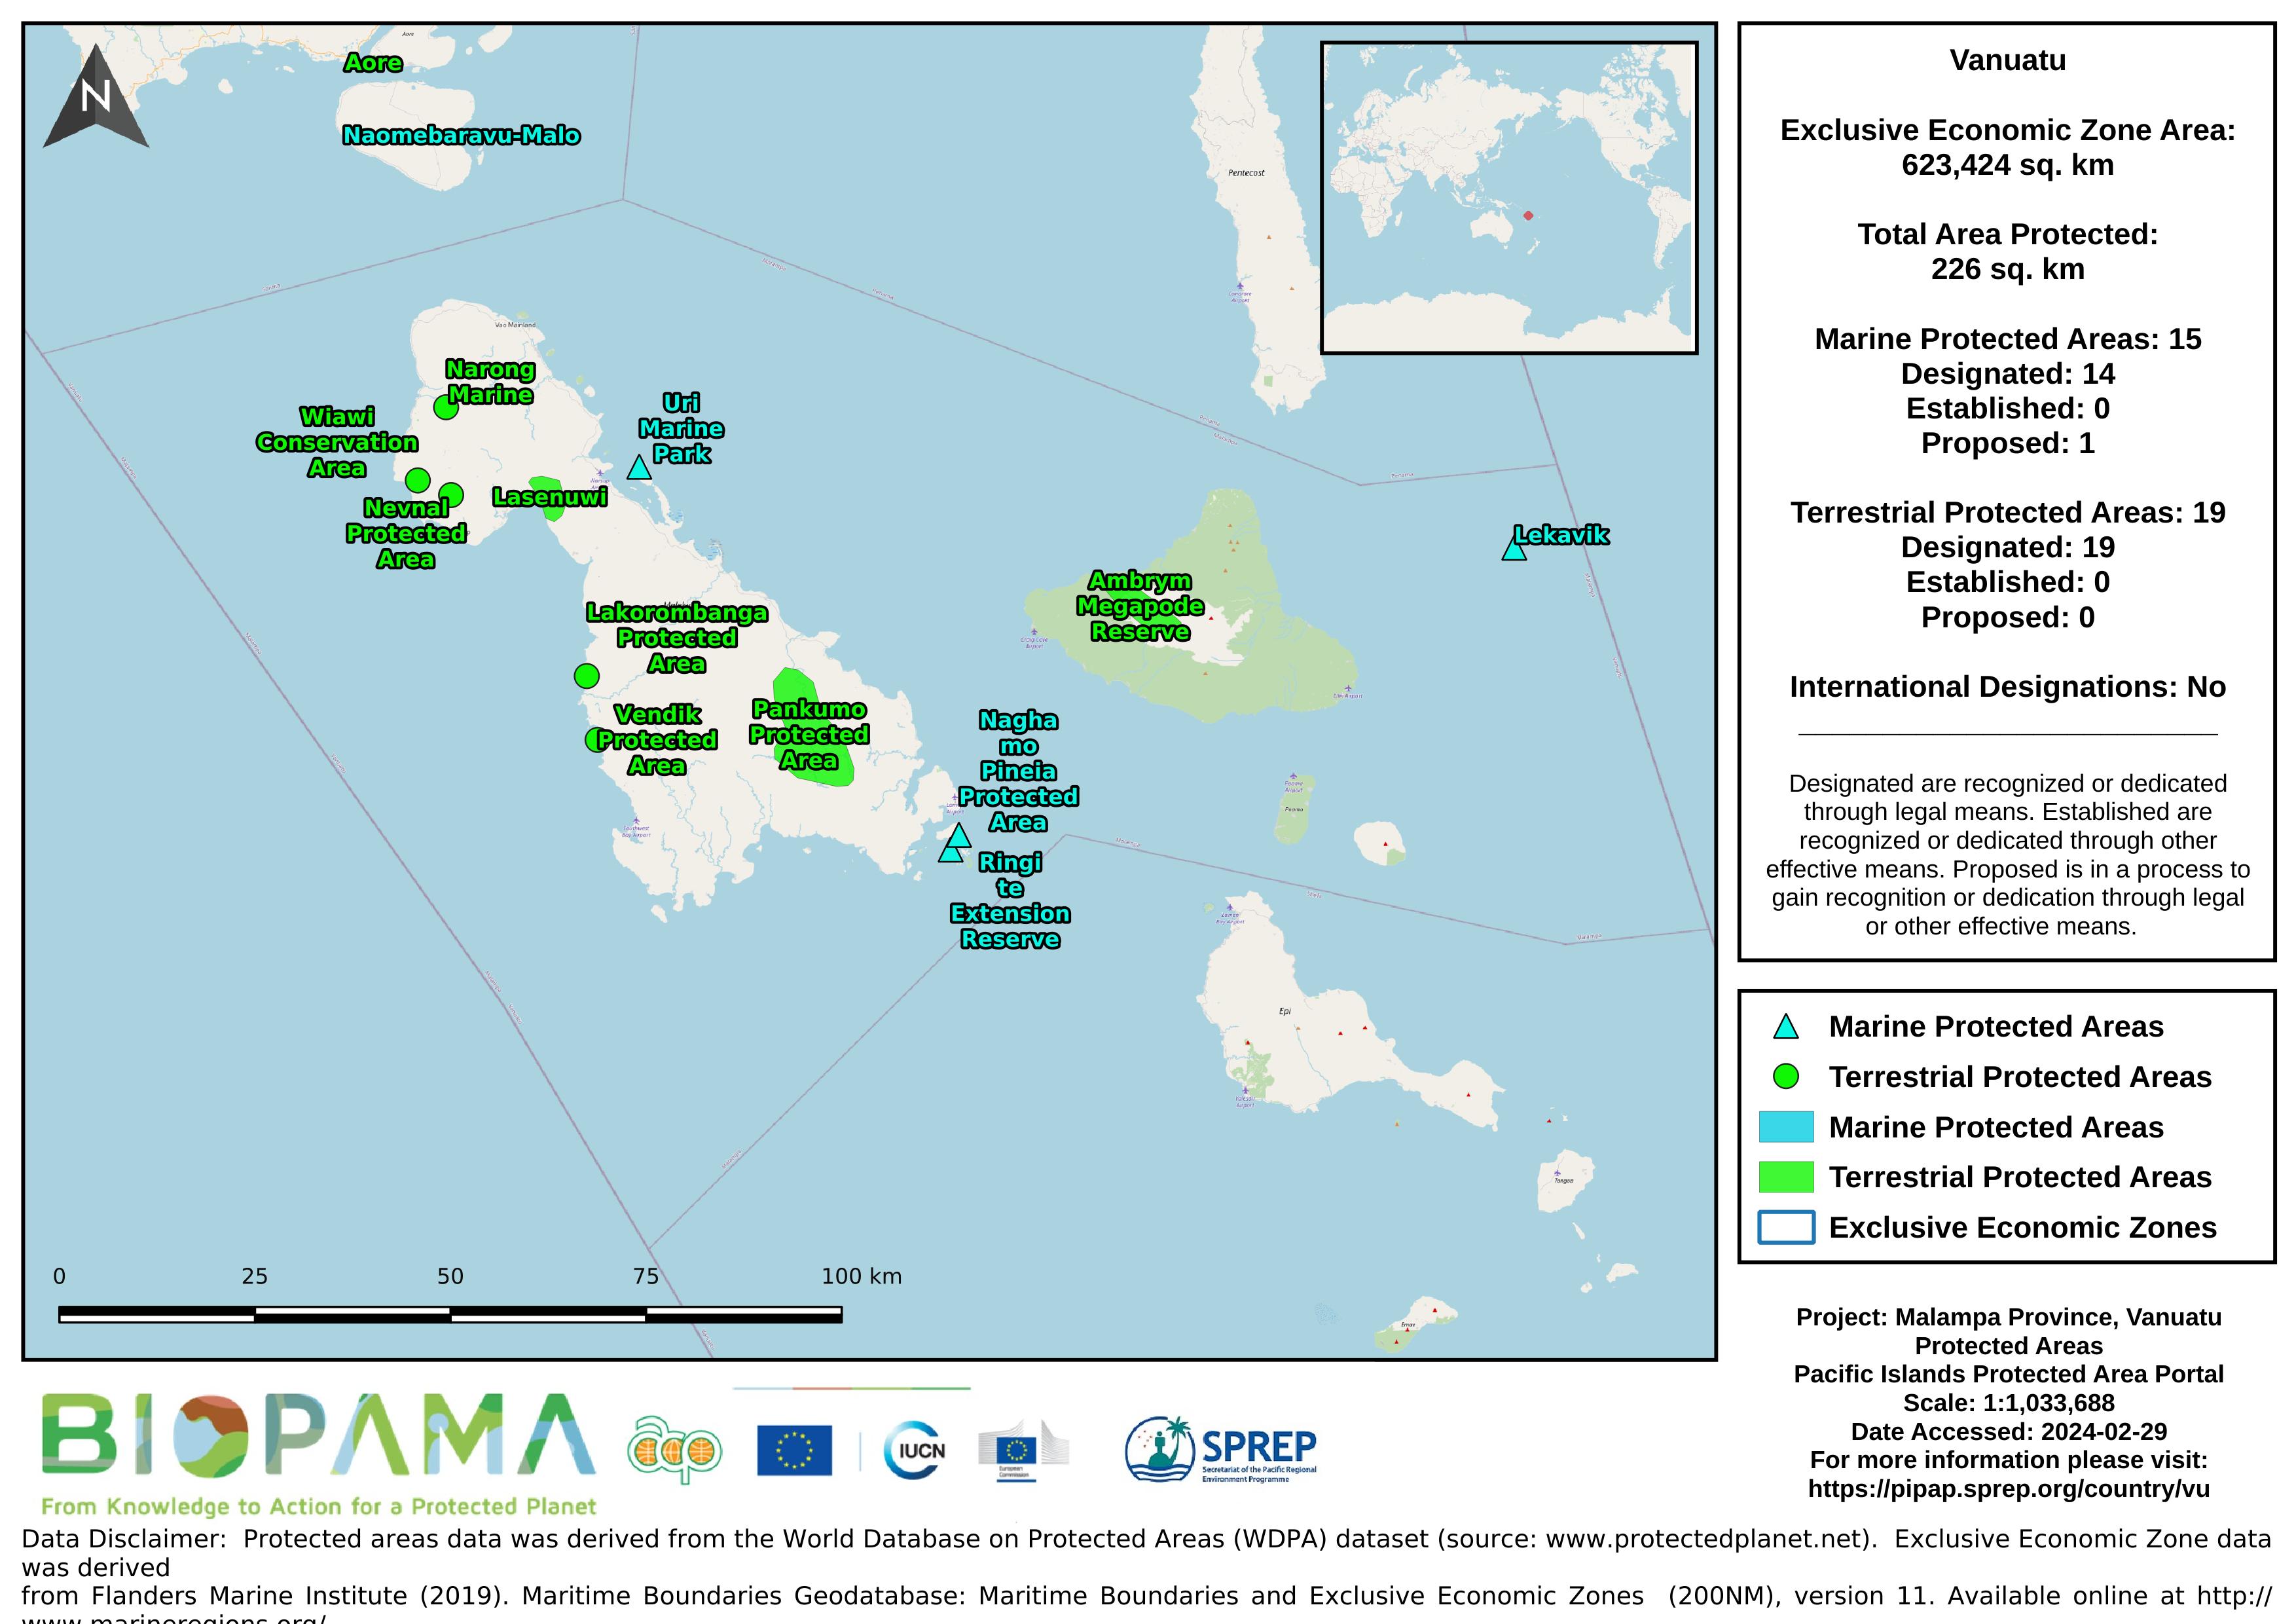
Map of the protected areas for Malampa Province, Vanuatu with country-level summary statistics on the amount of area under protection, count for each type of protected area (terrestrial or marine), and the count of their designation.
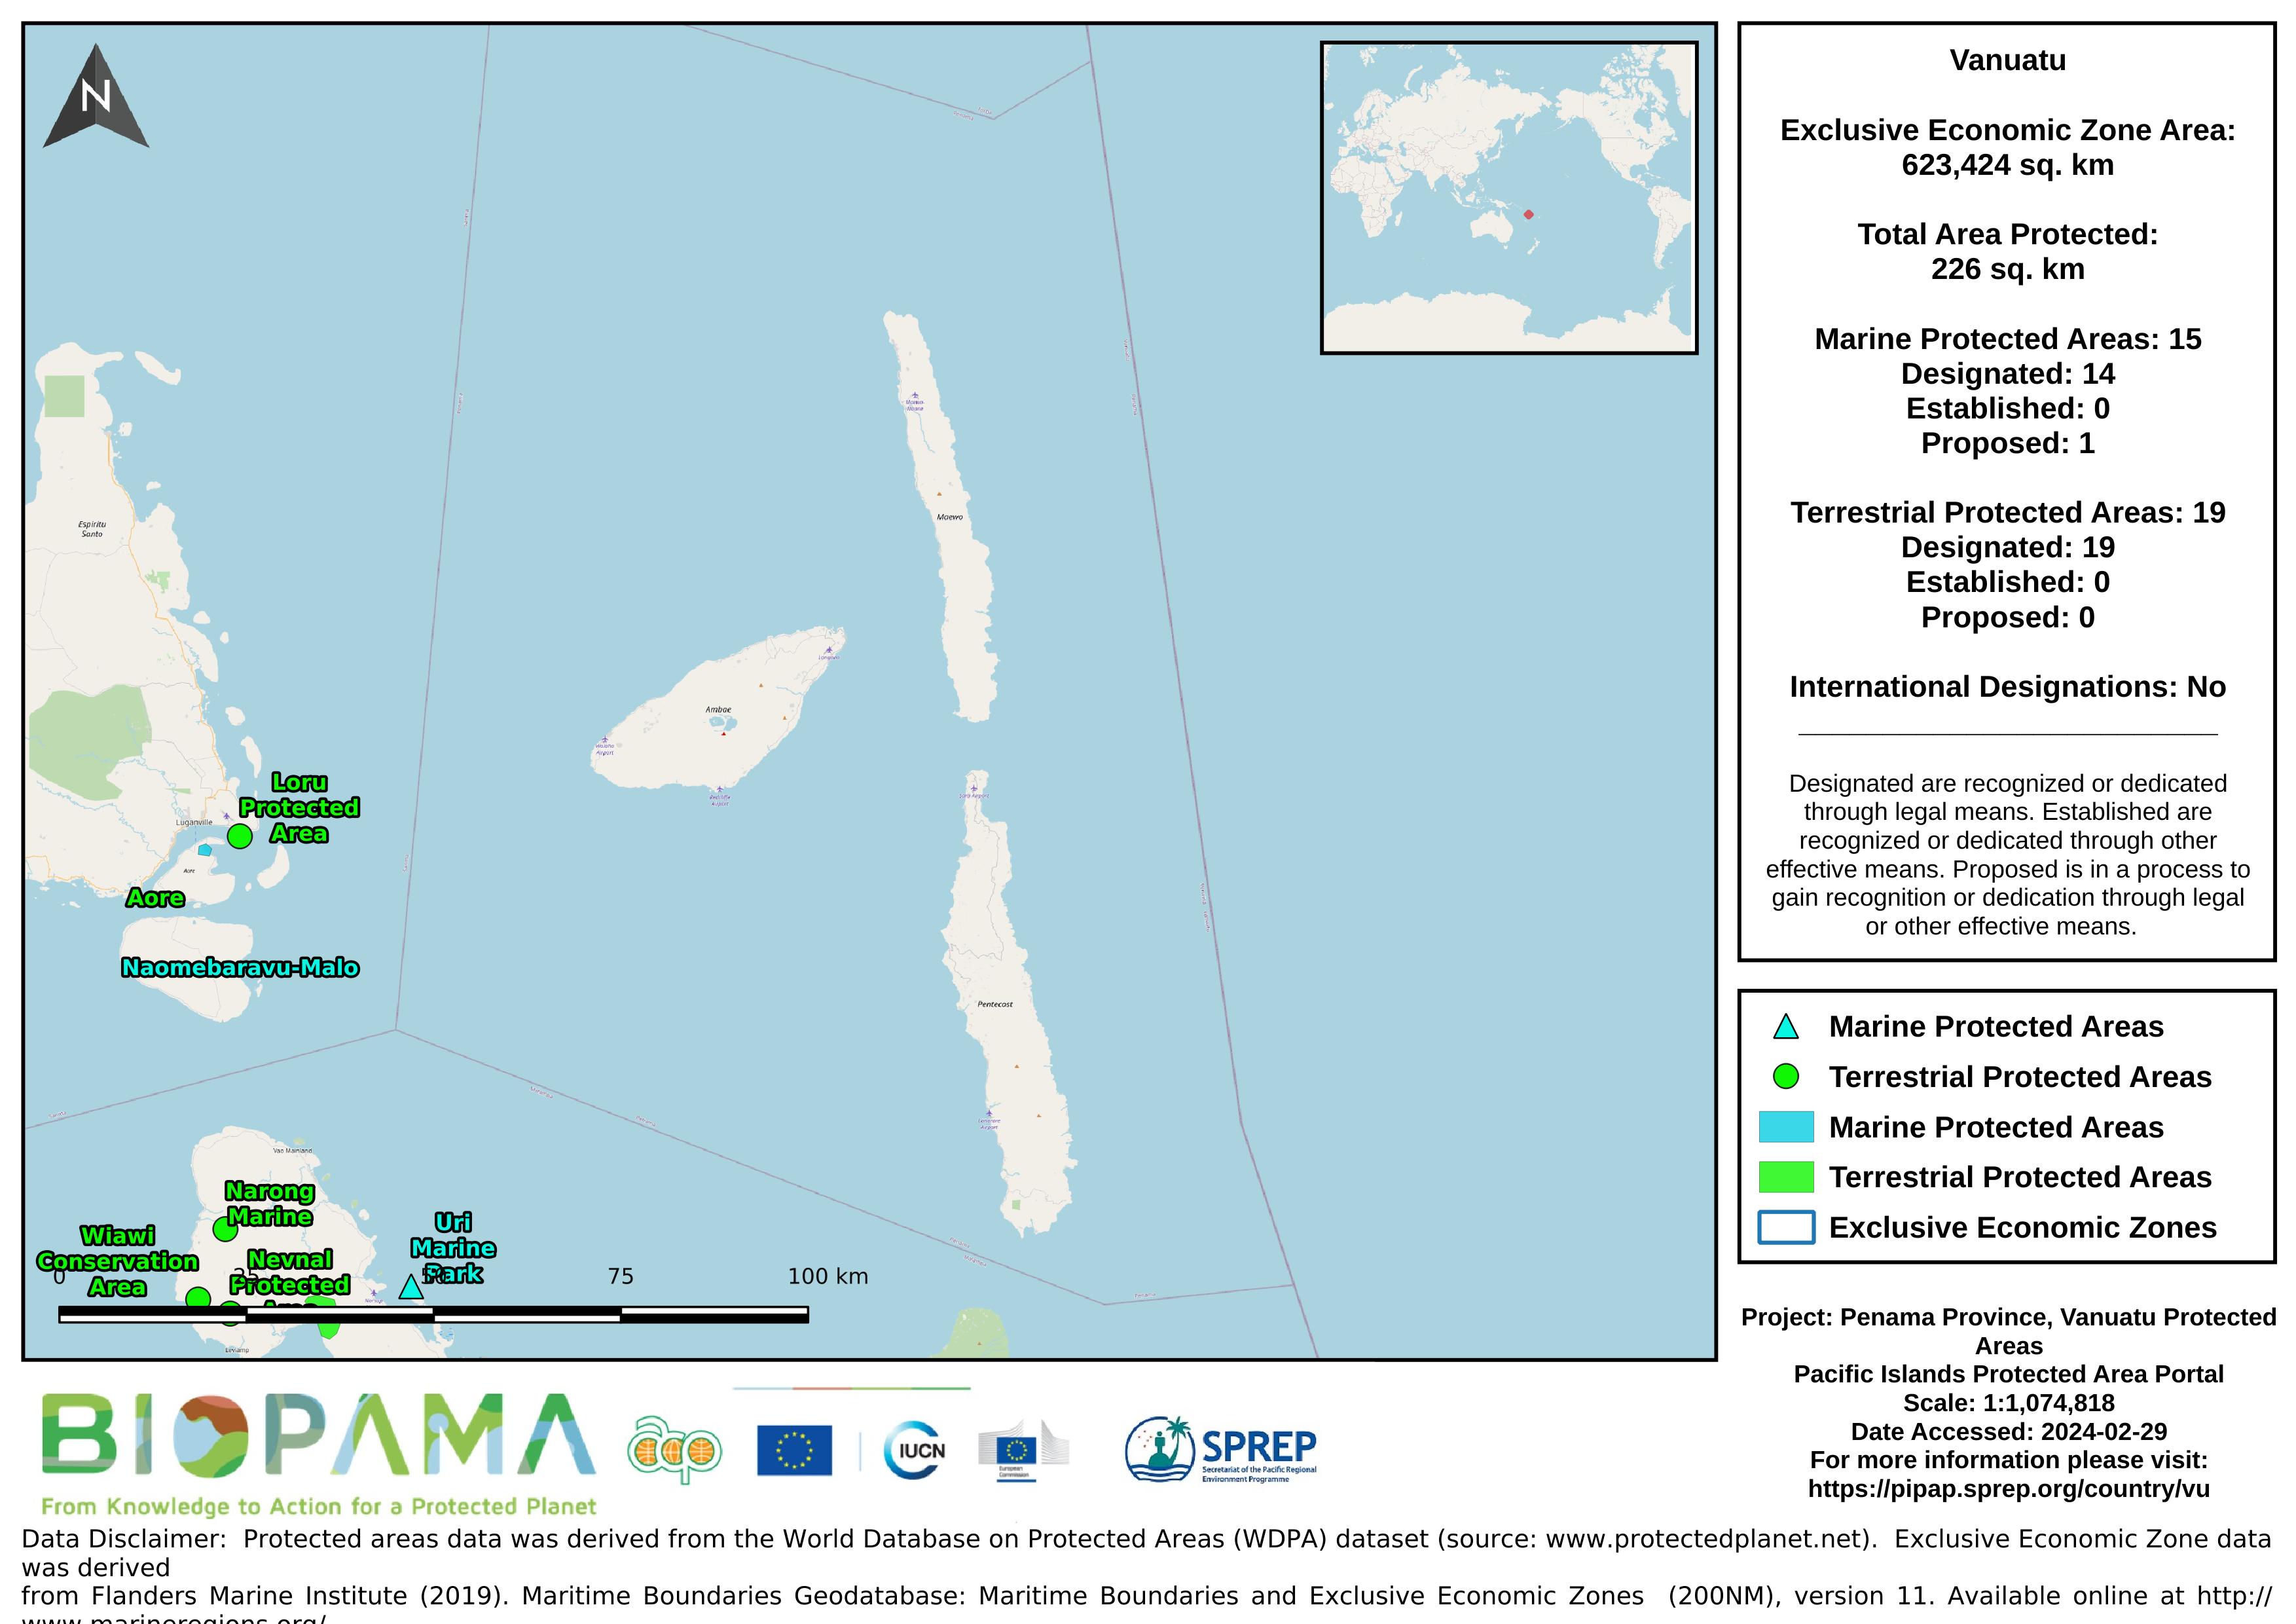
Map of the protected areas for Penama Province, Vanuatu with country-level summary statistics on the amount of area under protection, count for each type of protected area (terrestrial or marine), and the count of their designation.
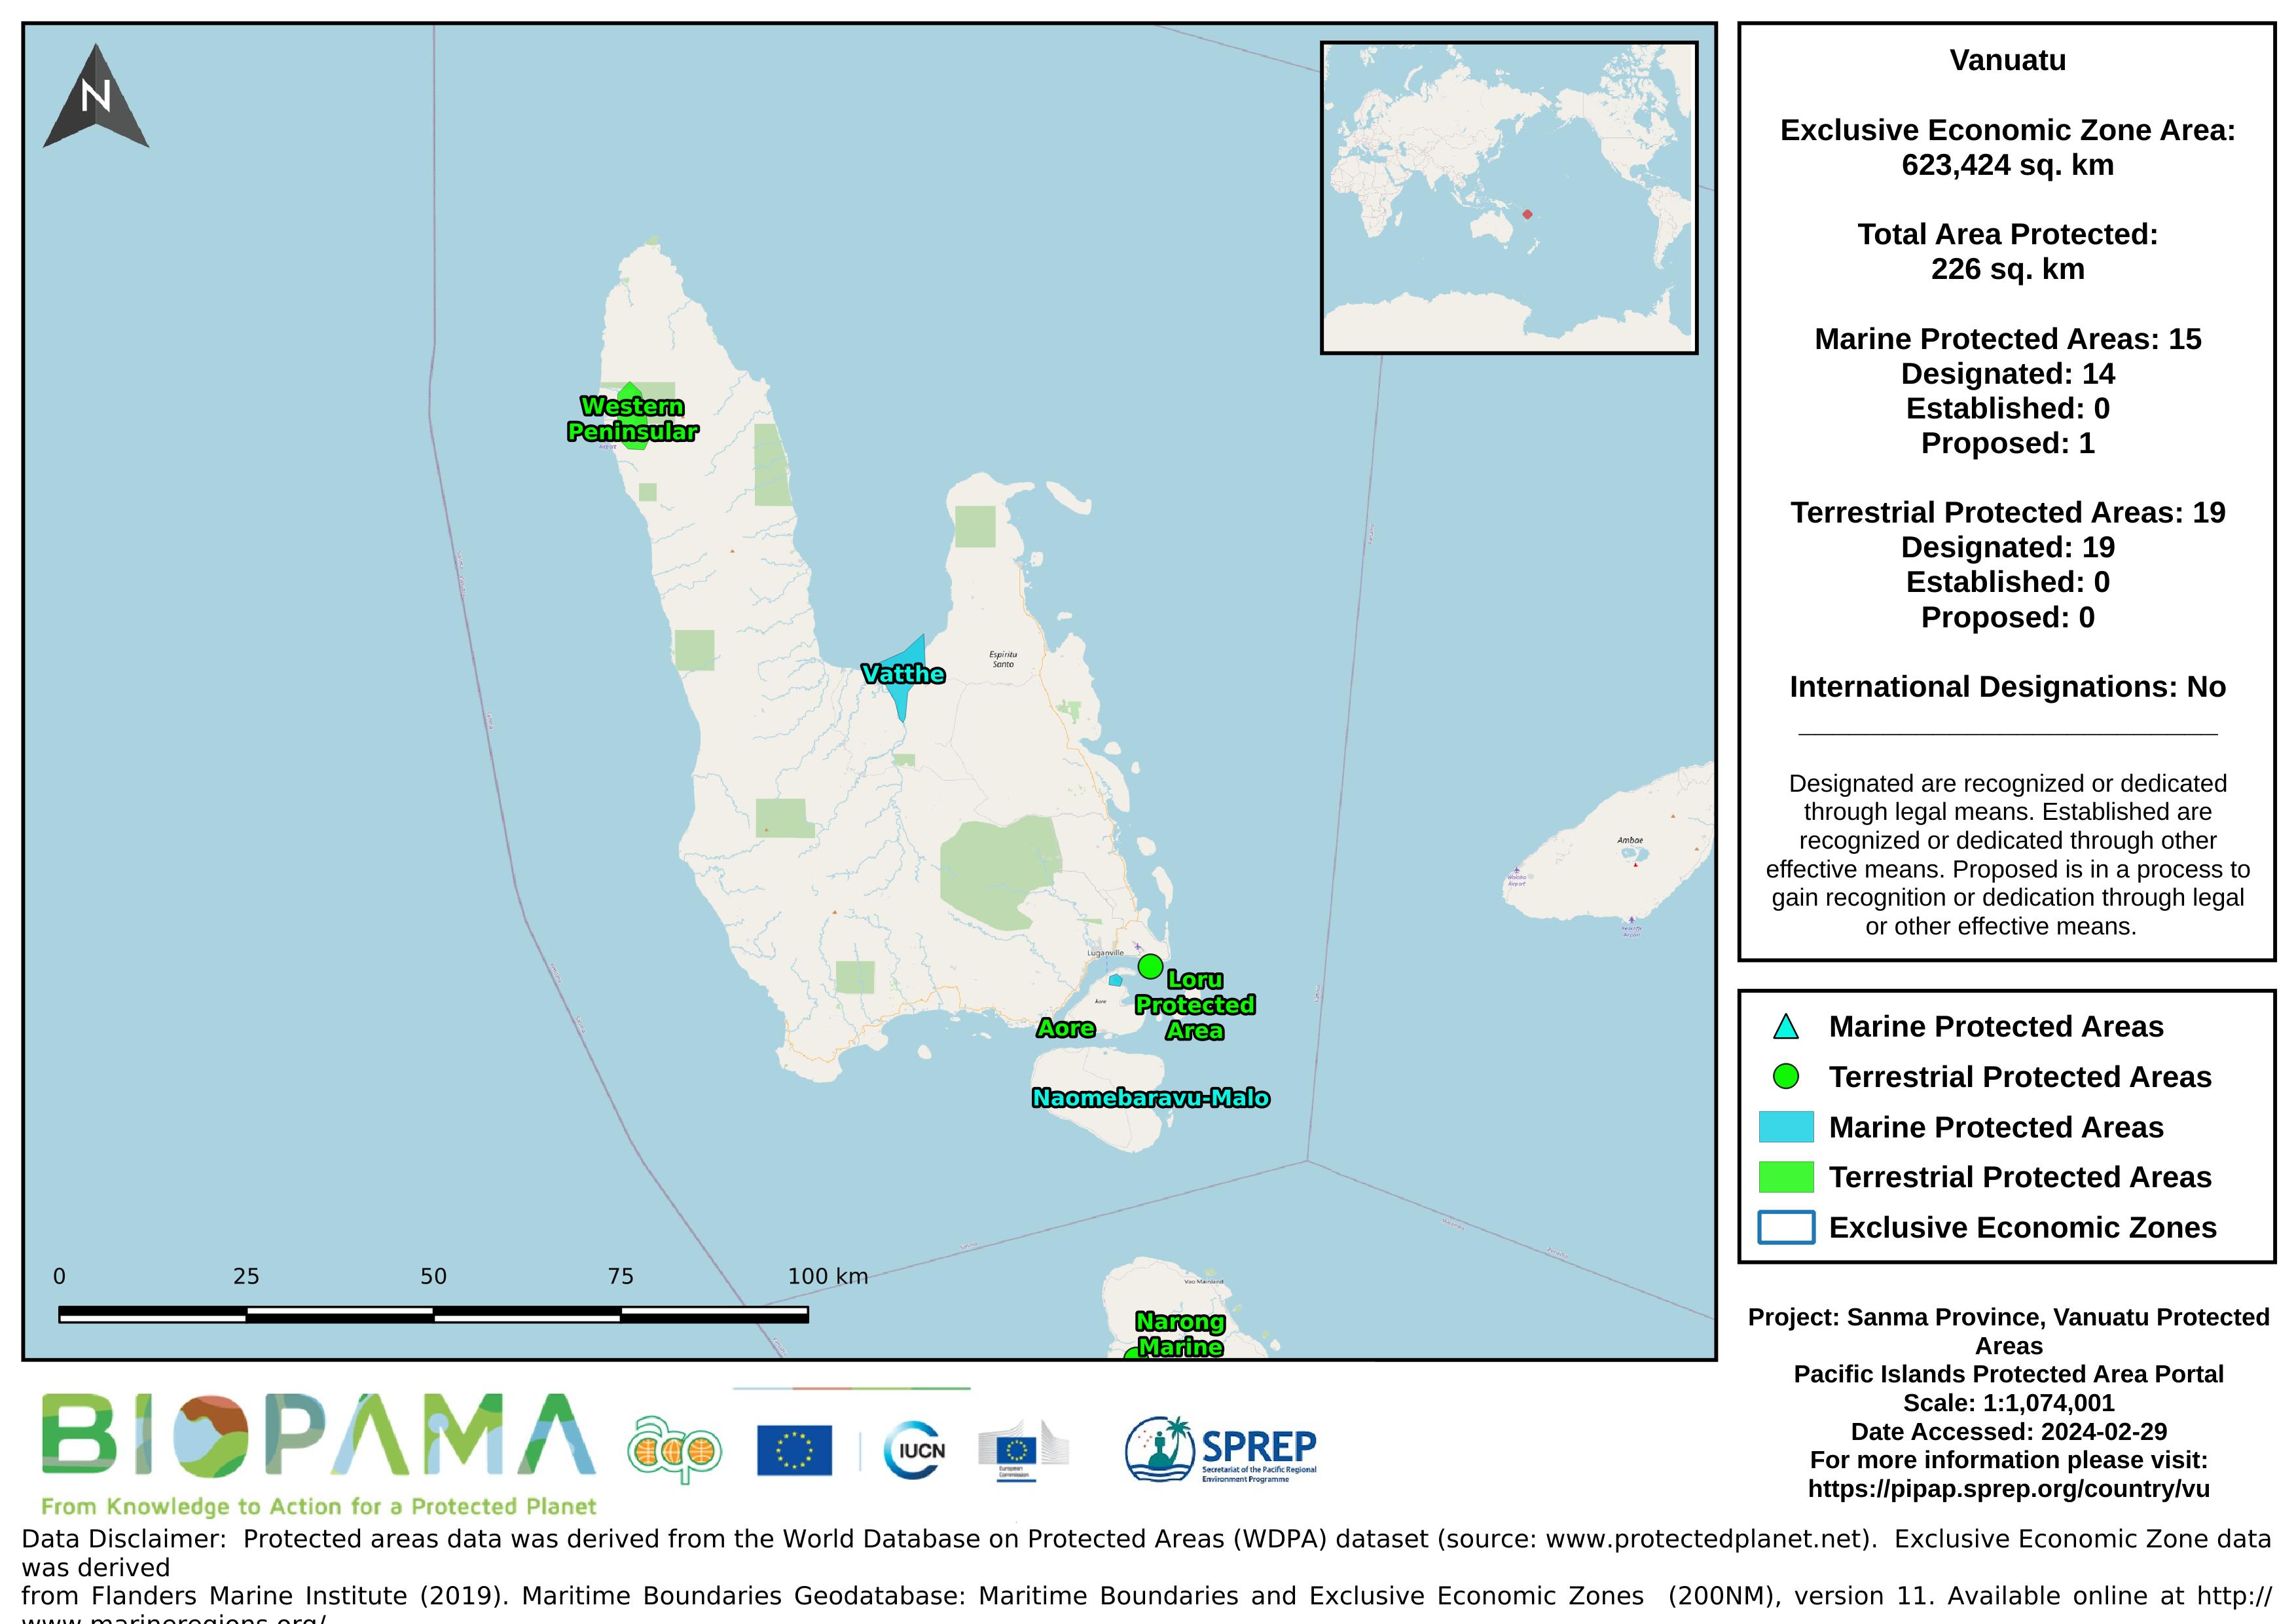
Map of the protected areas for Sanma Province, Vanuatu with country-level summary statistics on the amount of area under protection, count for each type of protected area (terrestrial or marine), and the count of their designation.
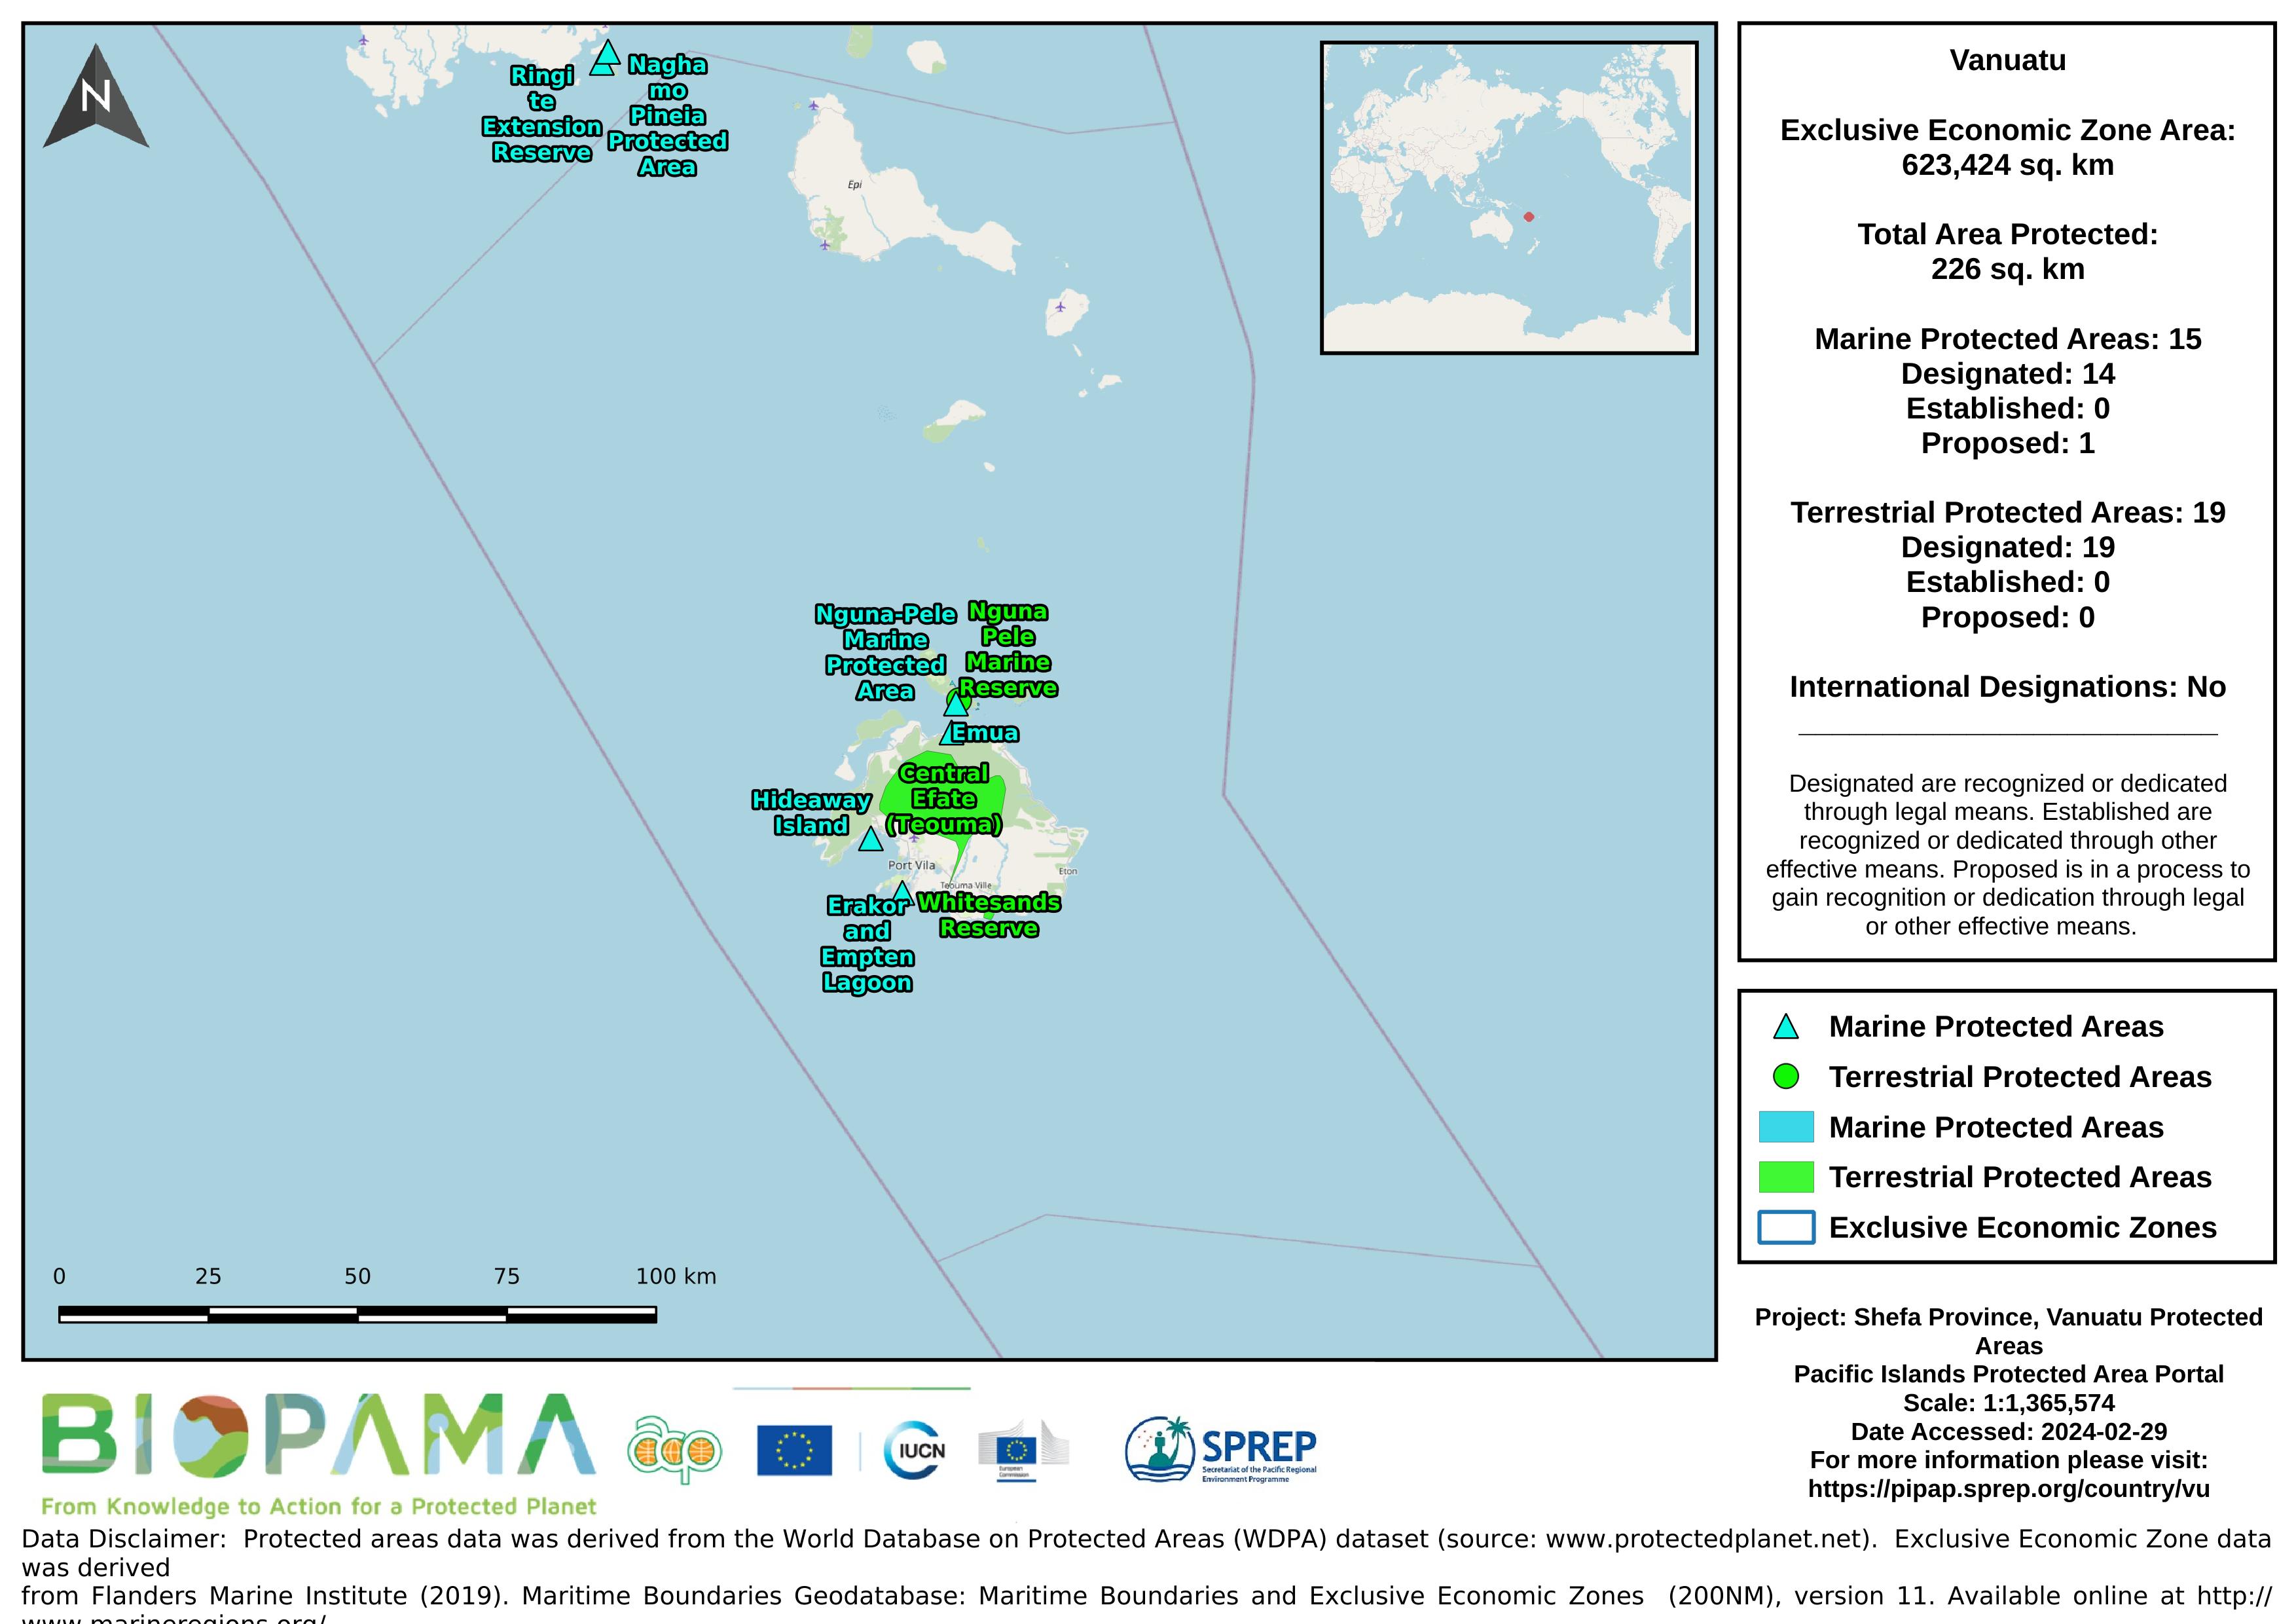
Map of the protected areas for Shefa Province, Vanuatu with country-level summary statistics on the amount of area under protection, count for each type of protected area (terrestrial or marine), and the count of their designation.
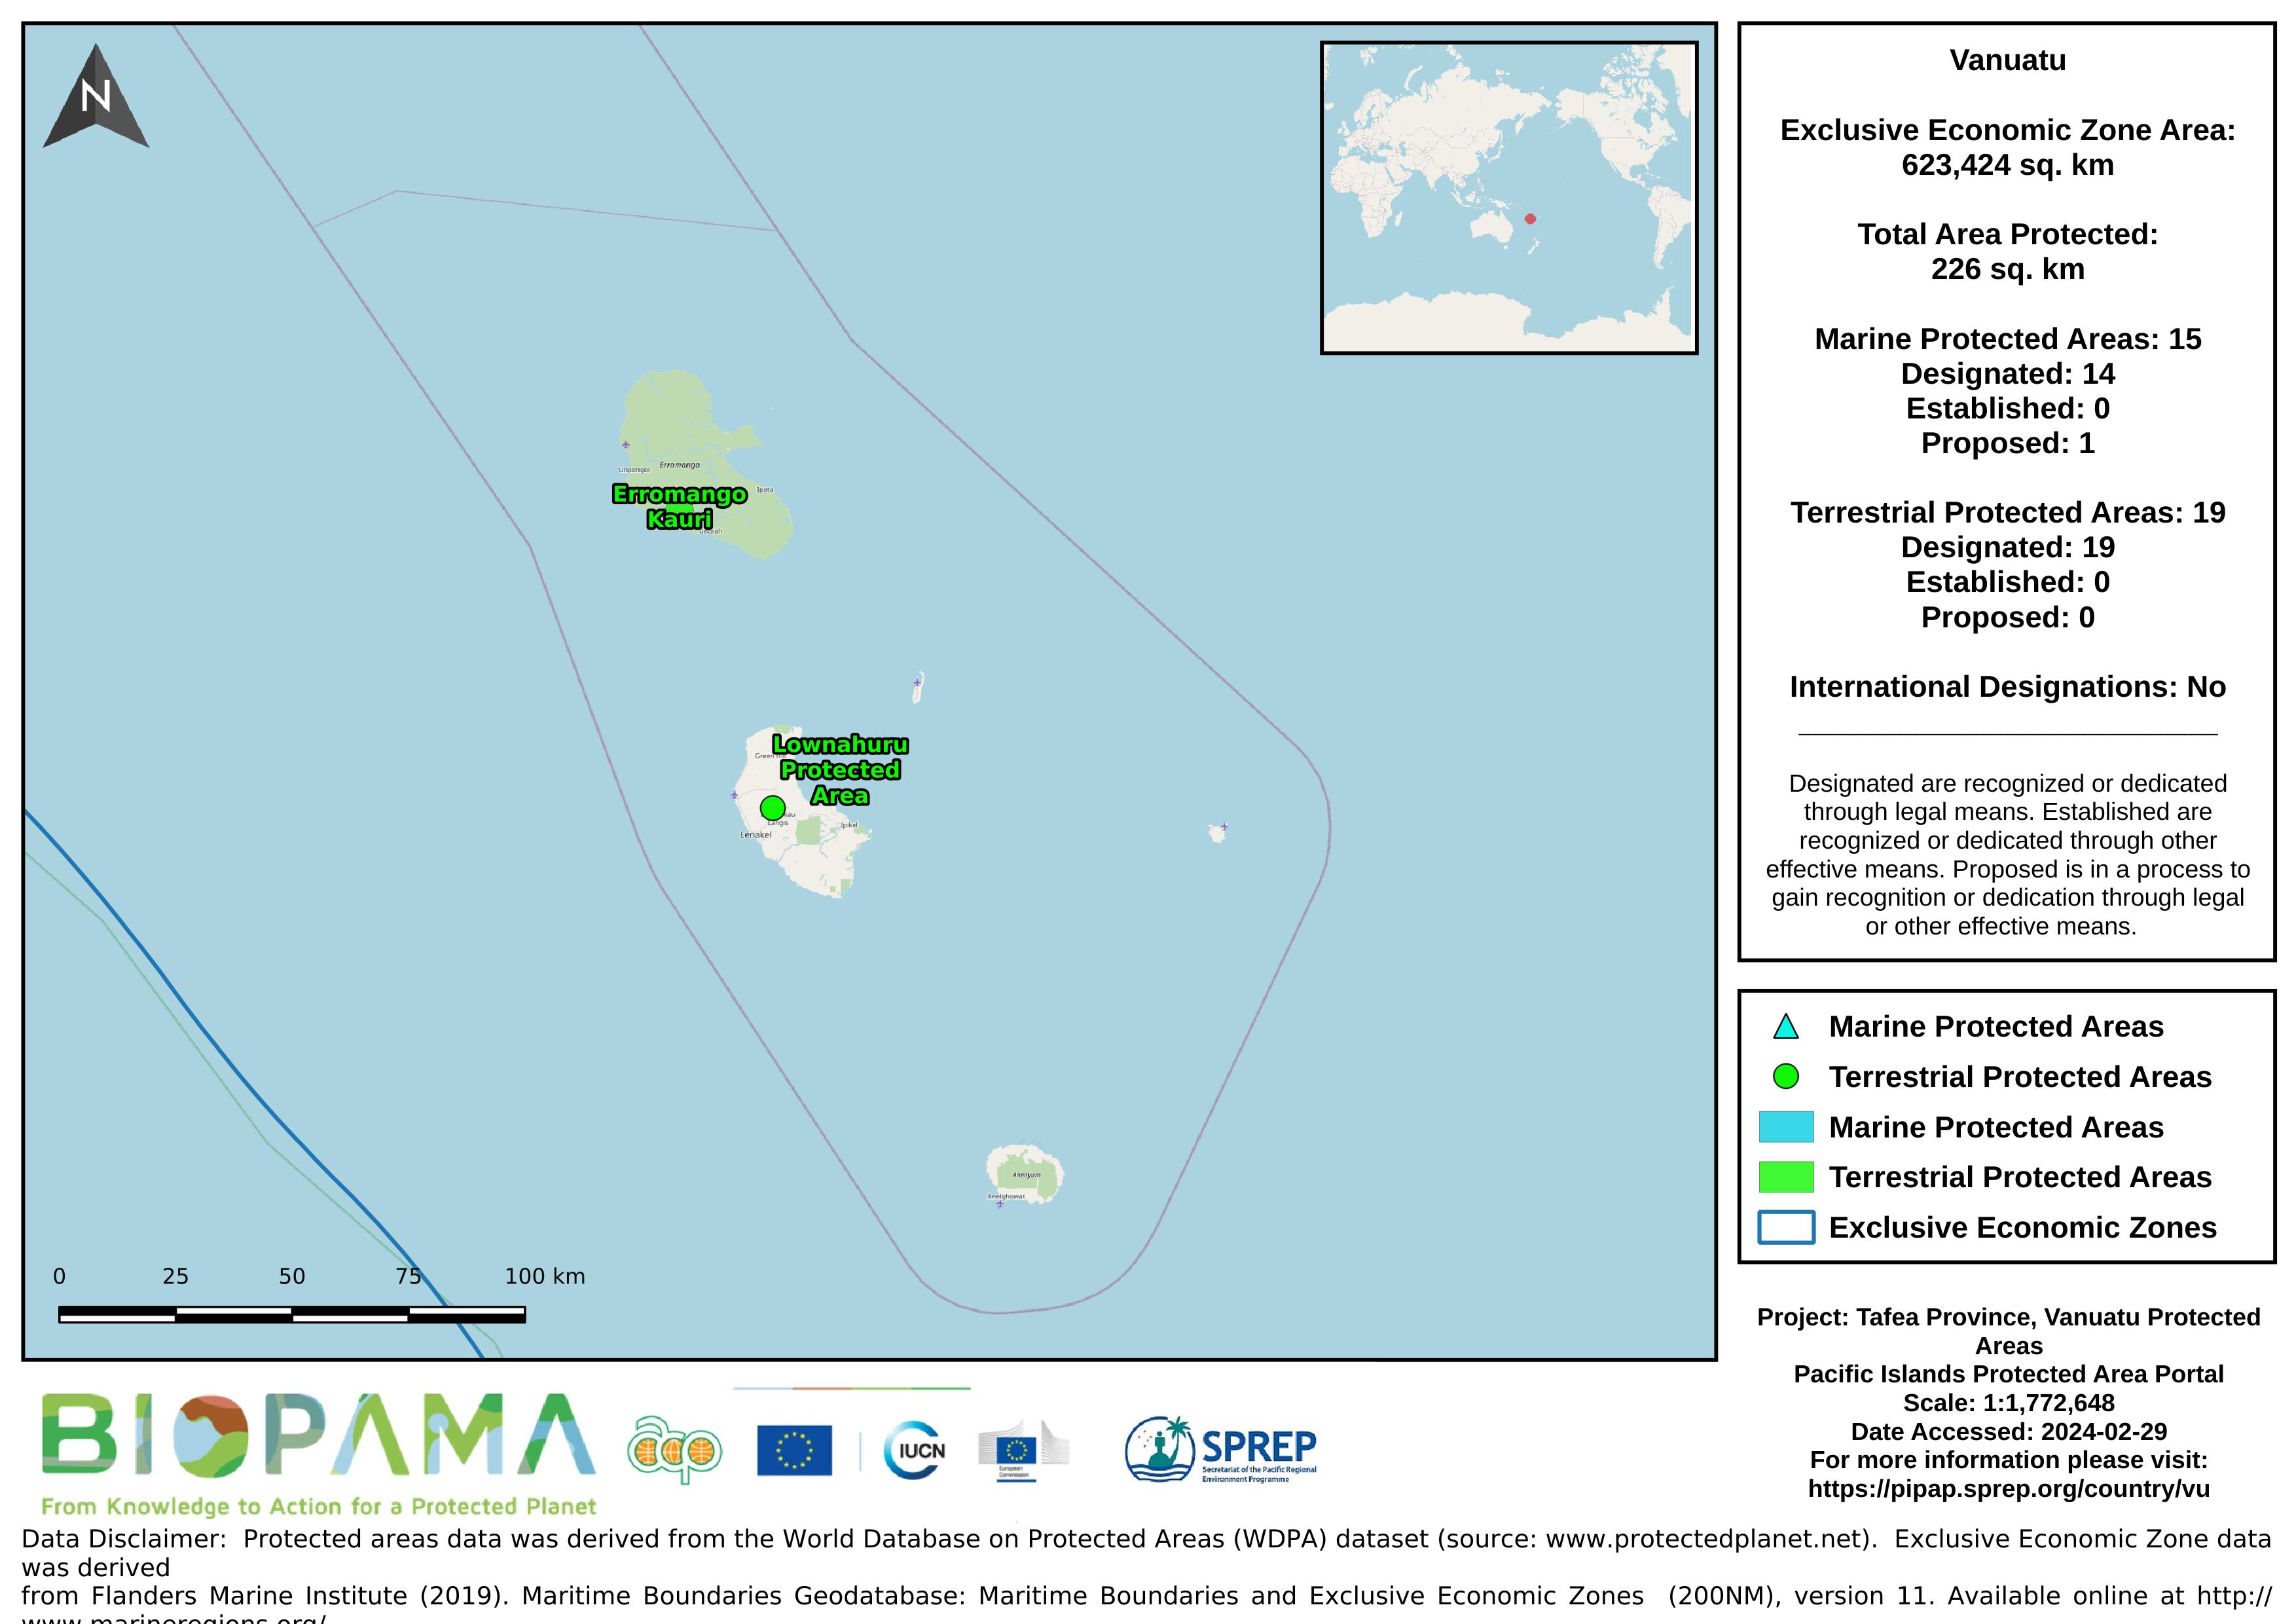
Map of the protected areas for Tafea Province, Vanuatu with country-level summary statistics on the amount of area under protection, count for each type of protected area (terrestrial or marine), and the count of their designation.
Map of the protected areas for Torba Province, Vanuatu with country-level summary statistics on the amount of area under protection, count for each type of protected area (terrestrial or marine), and the count of their designation.
Pacific islands region land area
In a unique move Tokelau requested all regional and international organizations that it is affiliated to either through full membership, associate or by accessing through regional international projects, to visit and consult Tokelau as a "body corporate" or all at once. The intention is to assist a small tiny country in managing all the possible assistance available from these organizations so that the actual assistance itself could be much more effective in their delivery and avoid duplication.
Raster data representing the mean levels of calcite in µmol/m3 for the surface water layer. The data are available for global-scale applications at a spatial resolution of 5 arcmin (approximately 9.2 km at the equator).
Marine data layers for present conditions were produced with climate data describing monthly averages for the period 2000–2014, obtained from pre-processed global ocean re-analyses combining satellite and in situ observations at regular two- and three-dimensional spatial grids.
Raster data representing the mean levels of current velocities in meters/second for the surface water layer. The data are available for global-scale applications at a spatial resolution of 5 arcmin (approximately 9.2 km at the equator).
Marine data layers for present conditions were produced with climate data describing monthly averages for the period 2000–2014, obtained from pre-processed global ocean re-analyses combining satellite and in situ observations at regular two- and three-dimensional spatial grids.
Raster data representing the mean levels of iron in µmol/m3 for the surface water layer. The data are available for global-scale applications at a spatial resolution of 5 arcmin (approximately 9.2 km at the equator).
Marine data layers for present conditions were produced with climate data describing monthly averages for the period 2000–2014, obtained from pre-processed global ocean re-analyses combining satellite and in situ observations at regular two- and three-dimensional spatial grids.
Raster data representing the mean levels of pH for the surface water layer. The data are available for global-scale applications at a spatial resolution of 5 arcmin (approximately 9.2 km at the equator).
Marine data layers for present conditions were produced with climate data describing monthly averages for the period 2000–2014, obtained from pre-processed global ocean re-analyses combining satellite and in situ observations at regular two- and three-dimensional spatial grids.
Raster data representing the mean levels of photosynthetically active radiation (PAR) in E/m2/year for the surface water layer. The data are available for global-scale applications at a spatial resolution of 5 arcmin (approximately 9.2 km at the equator).
Marine data layers for present conditions were produced with climate data describing monthly averages for the period 2000–2014, obtained from pre-processed global ocean re-analyses combining satellite and in situ observations at regular two- and three-dimensional spatial grids.
REPORT 2: RECOMMENDATIONS FOR STRENGTHENING THE ACTION STRATEGY AND ENHANCING ITS IMPLEMENTATION
2008-2012 Action Strategy For Nature Conservation Principles For Nature Conservation Progress Report
REPORT 1: PROGRESS ACHIEVED TOWARDS THE OBJECTIVES OF THE ACTION STRATEGY DURING THE PAST FIVE YEARS