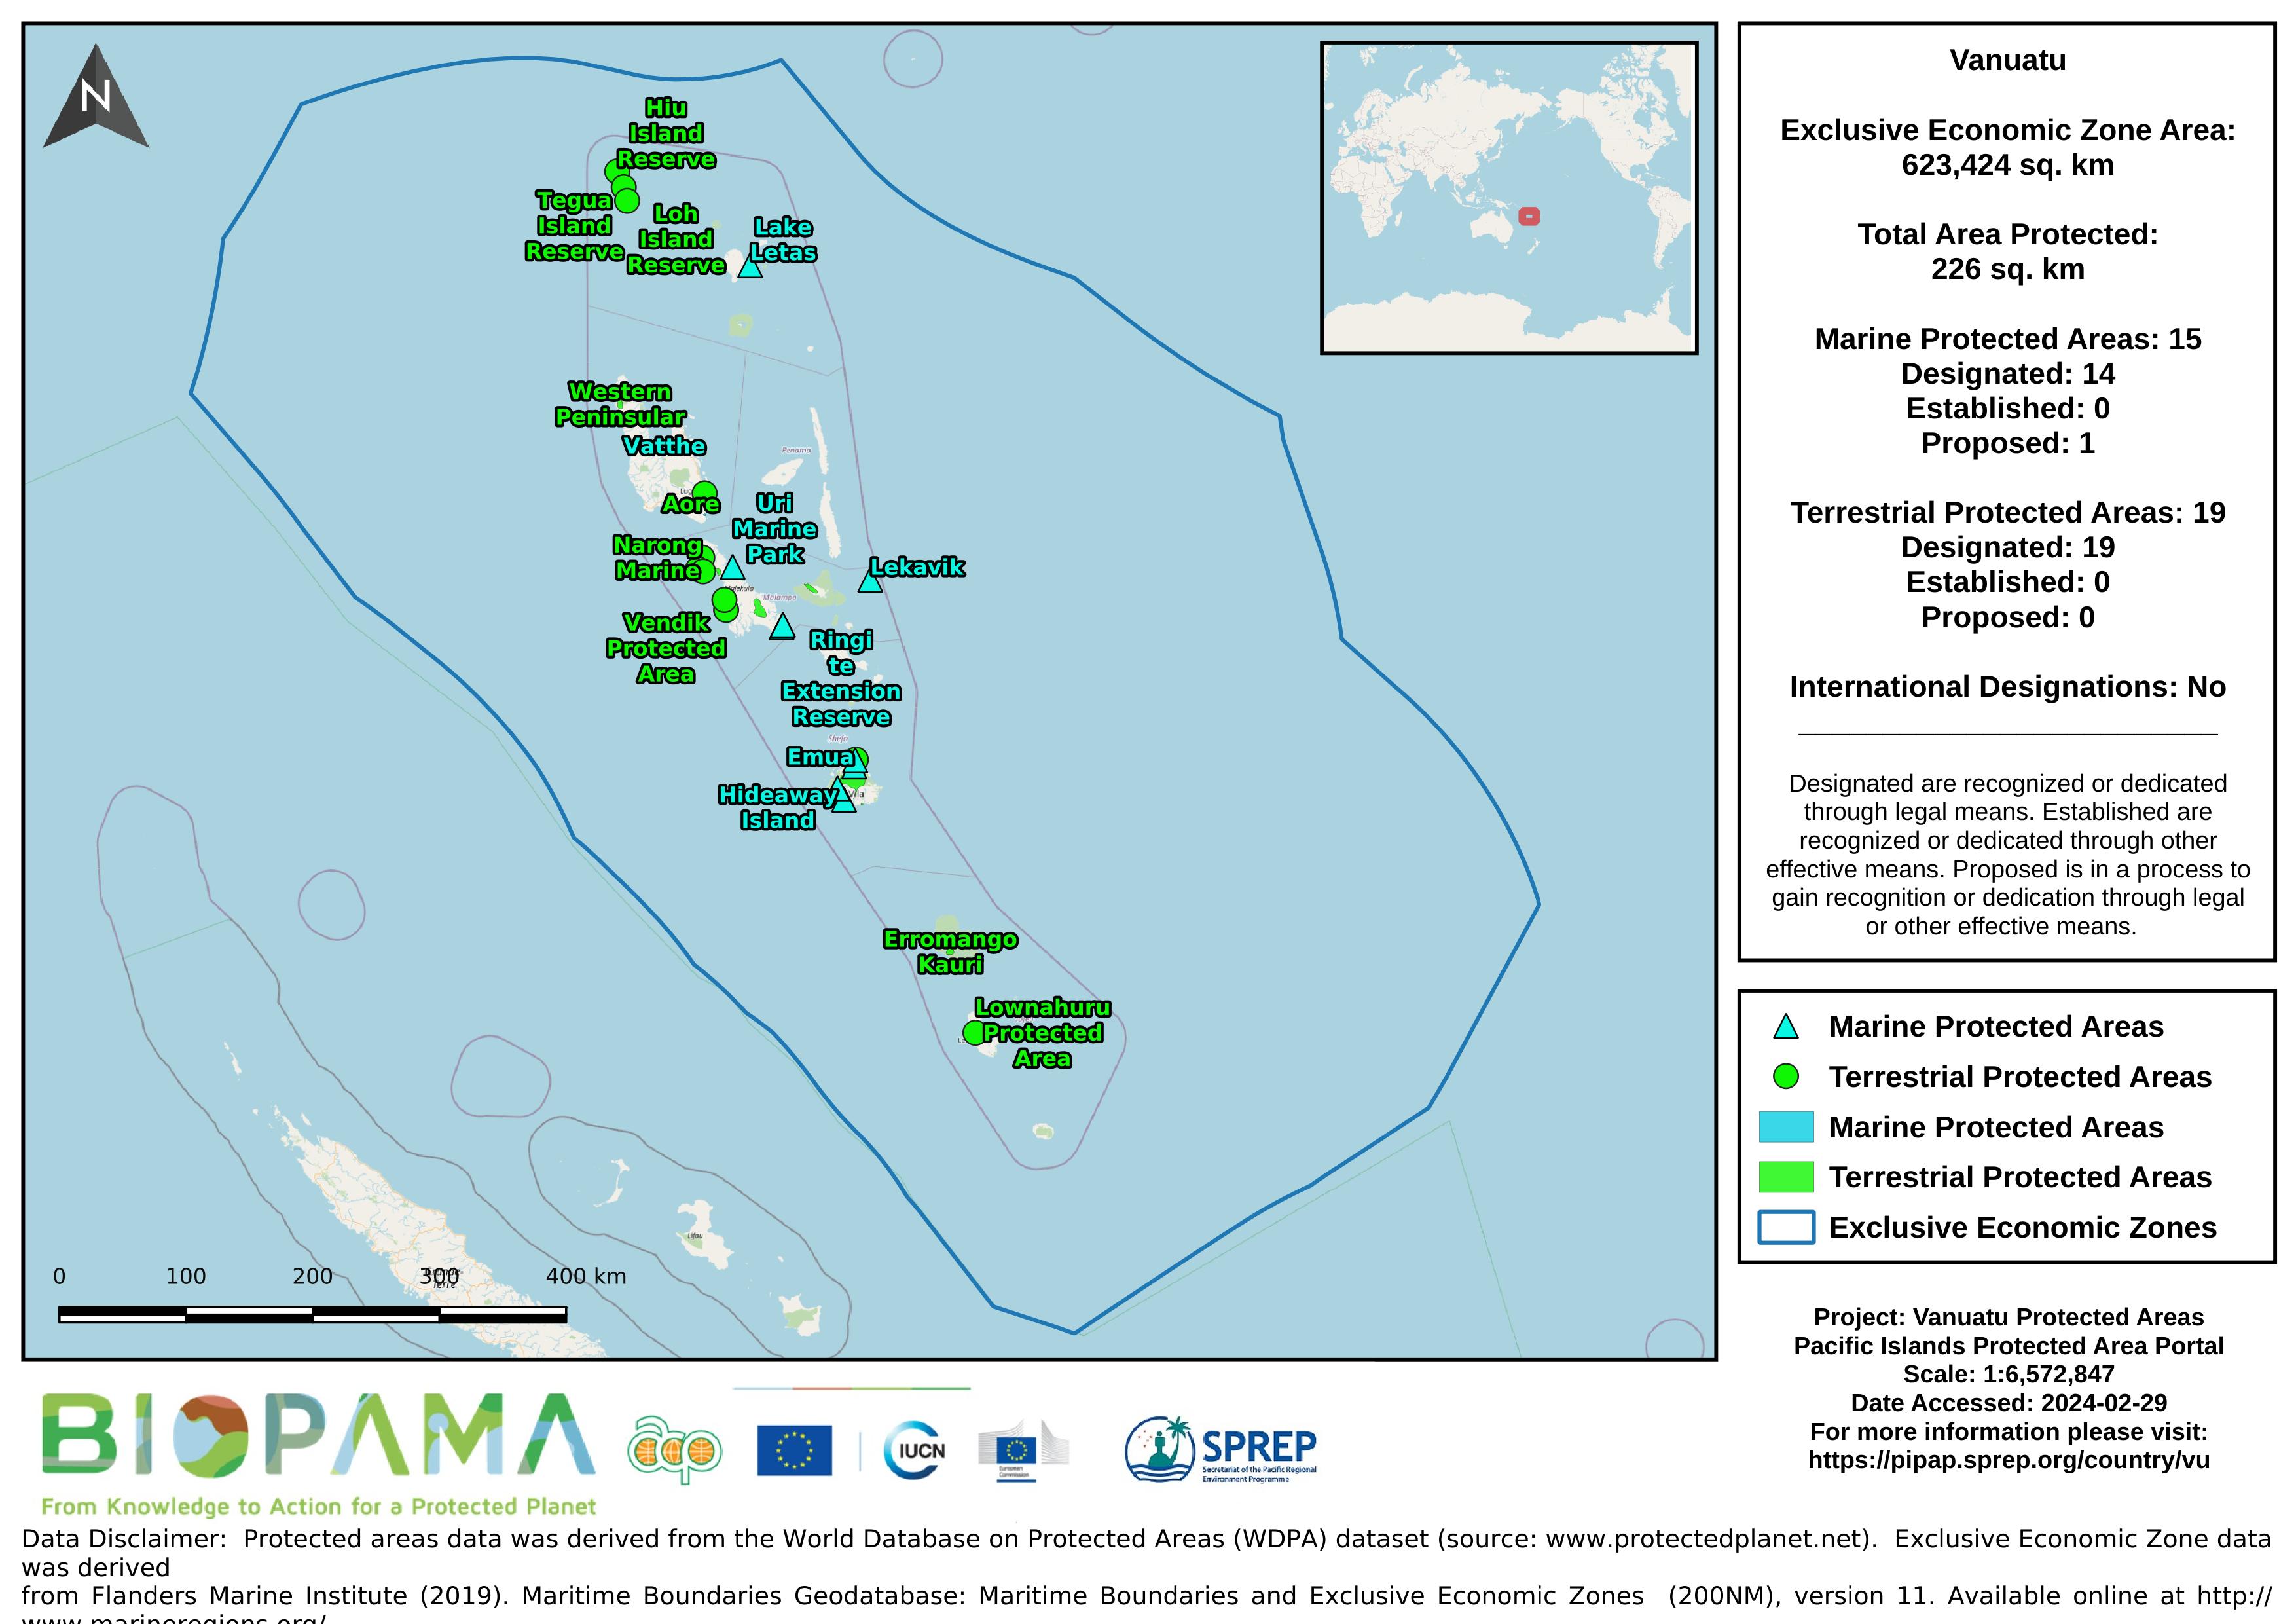
Map of the protected areas for Vanuatu with country-level summary statistics on the amount of area under protection, count for each type of protected area (terrestrial or marine), and the count of their designation.
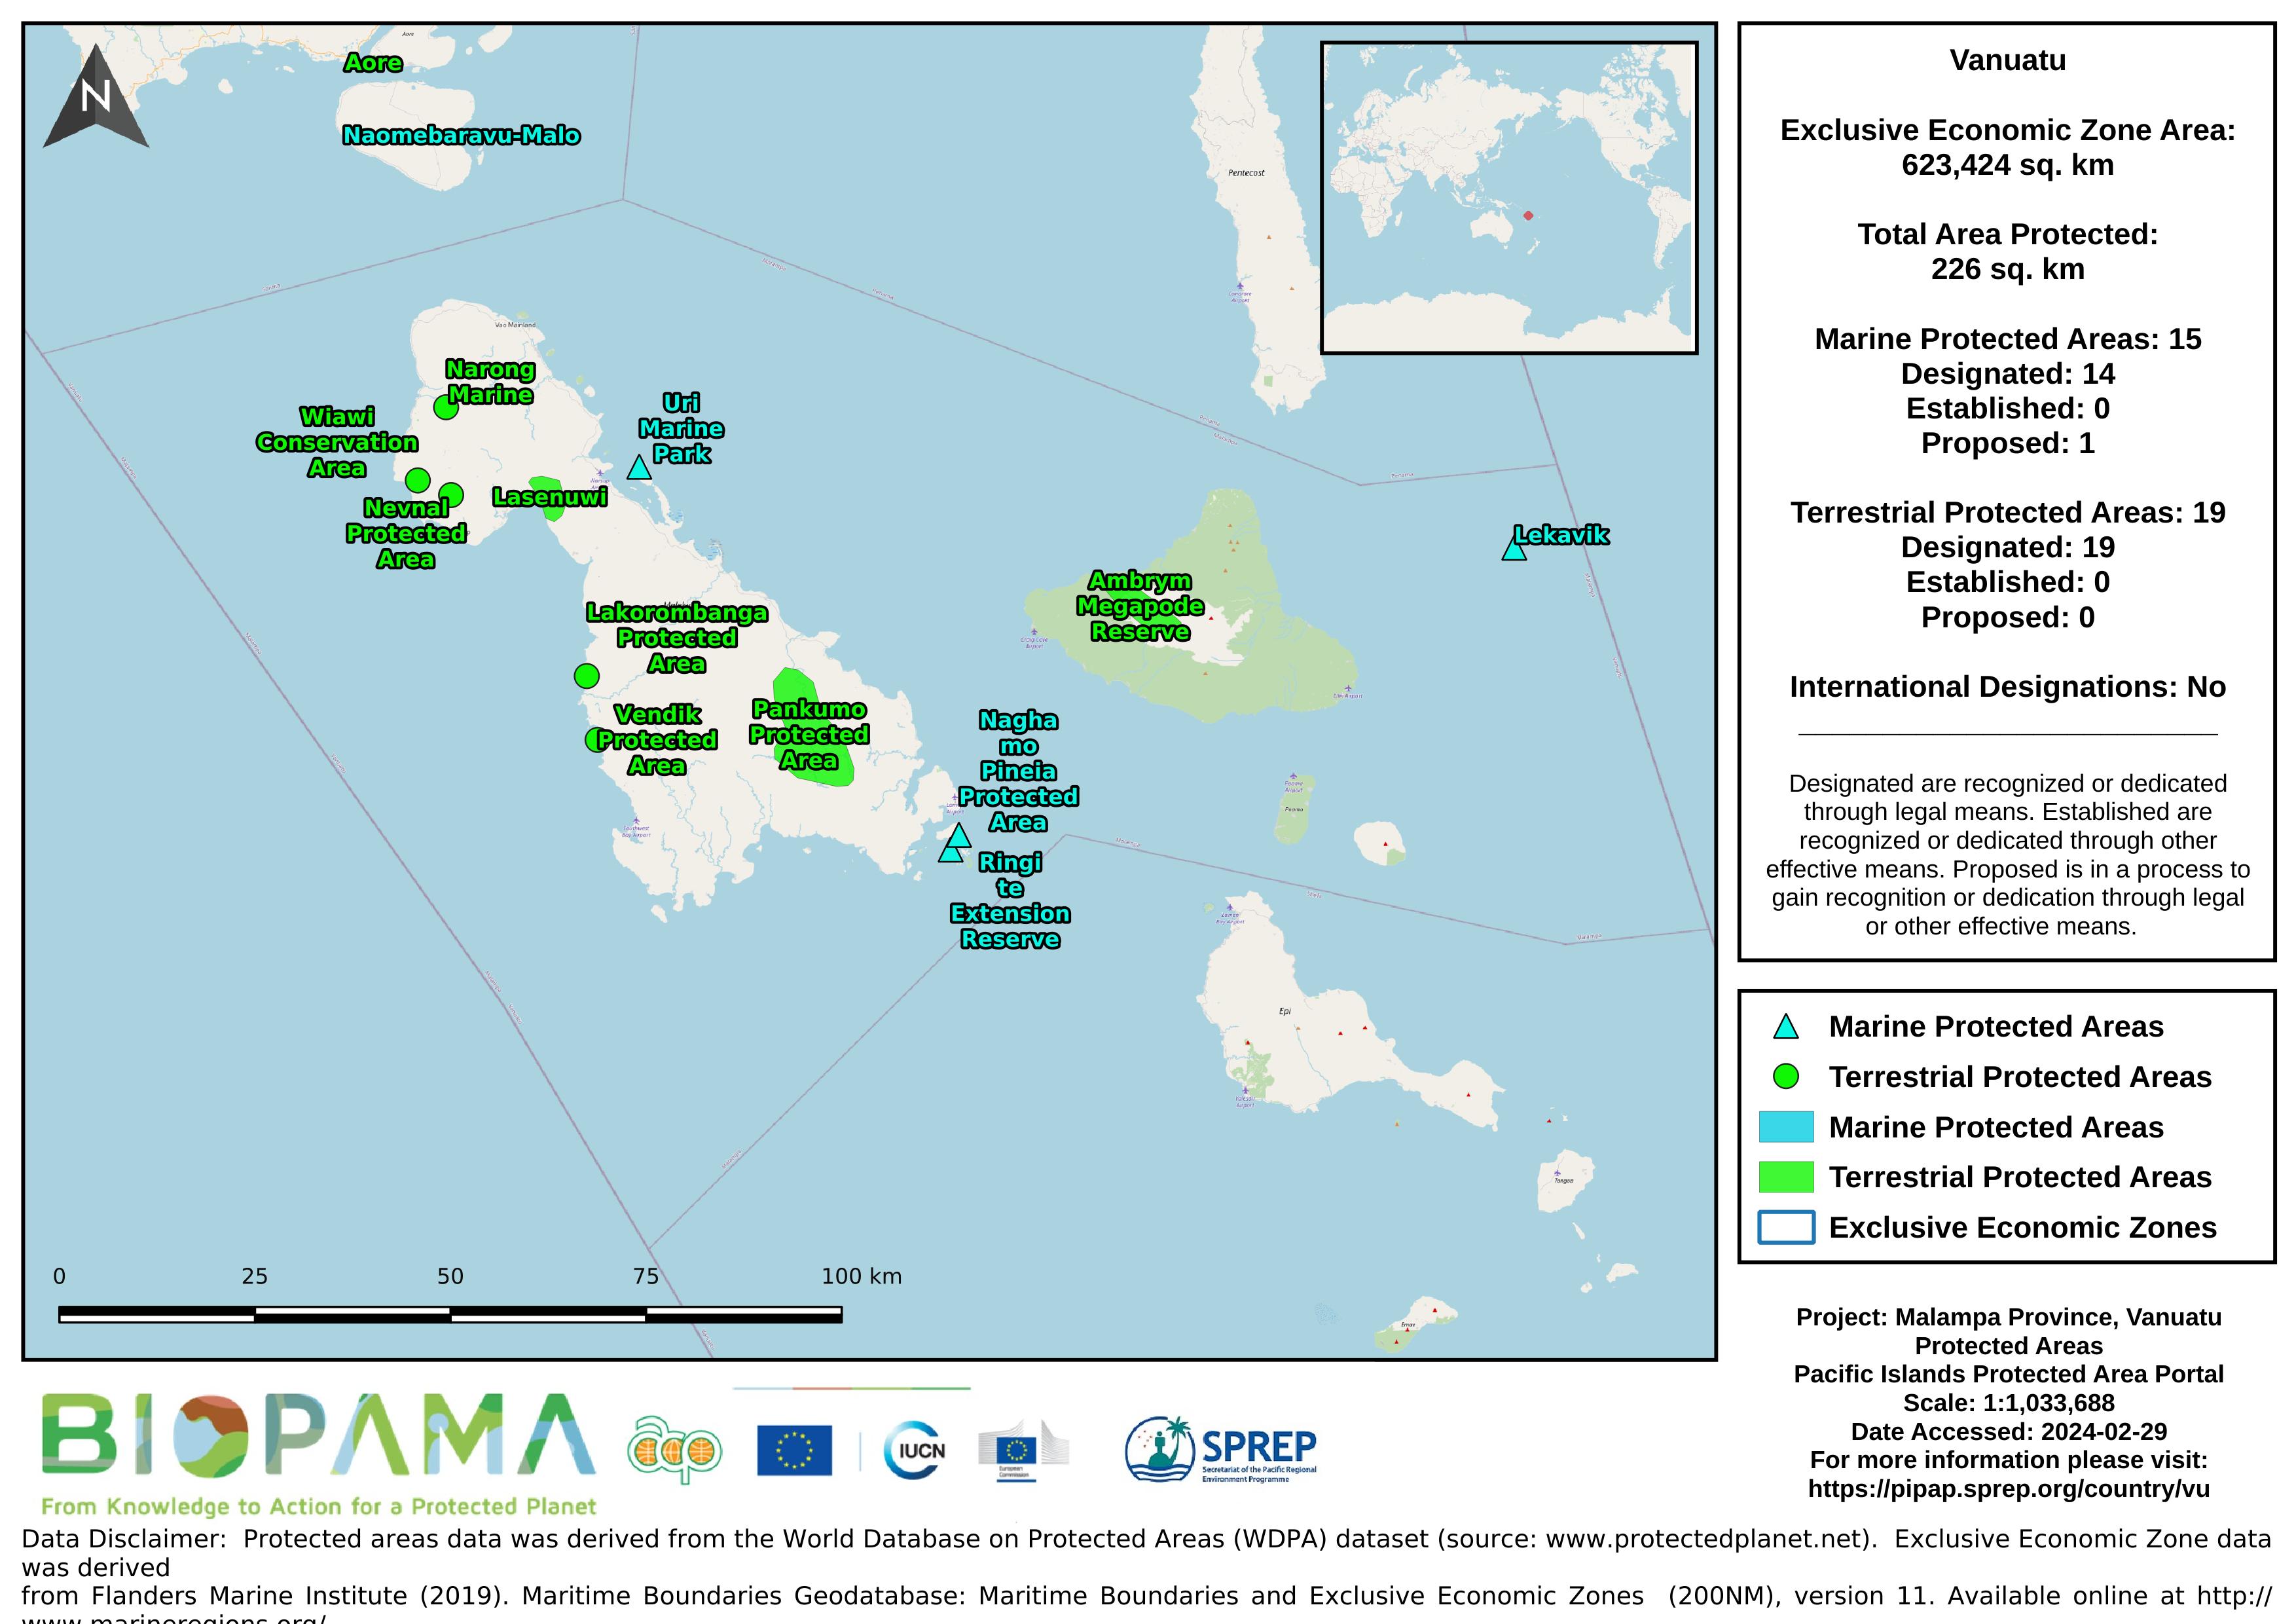
Map of the protected areas for Malampa Province, Vanuatu with country-level summary statistics on the amount of area under protection, count for each type of protected area (terrestrial or marine), and the count of their designation.
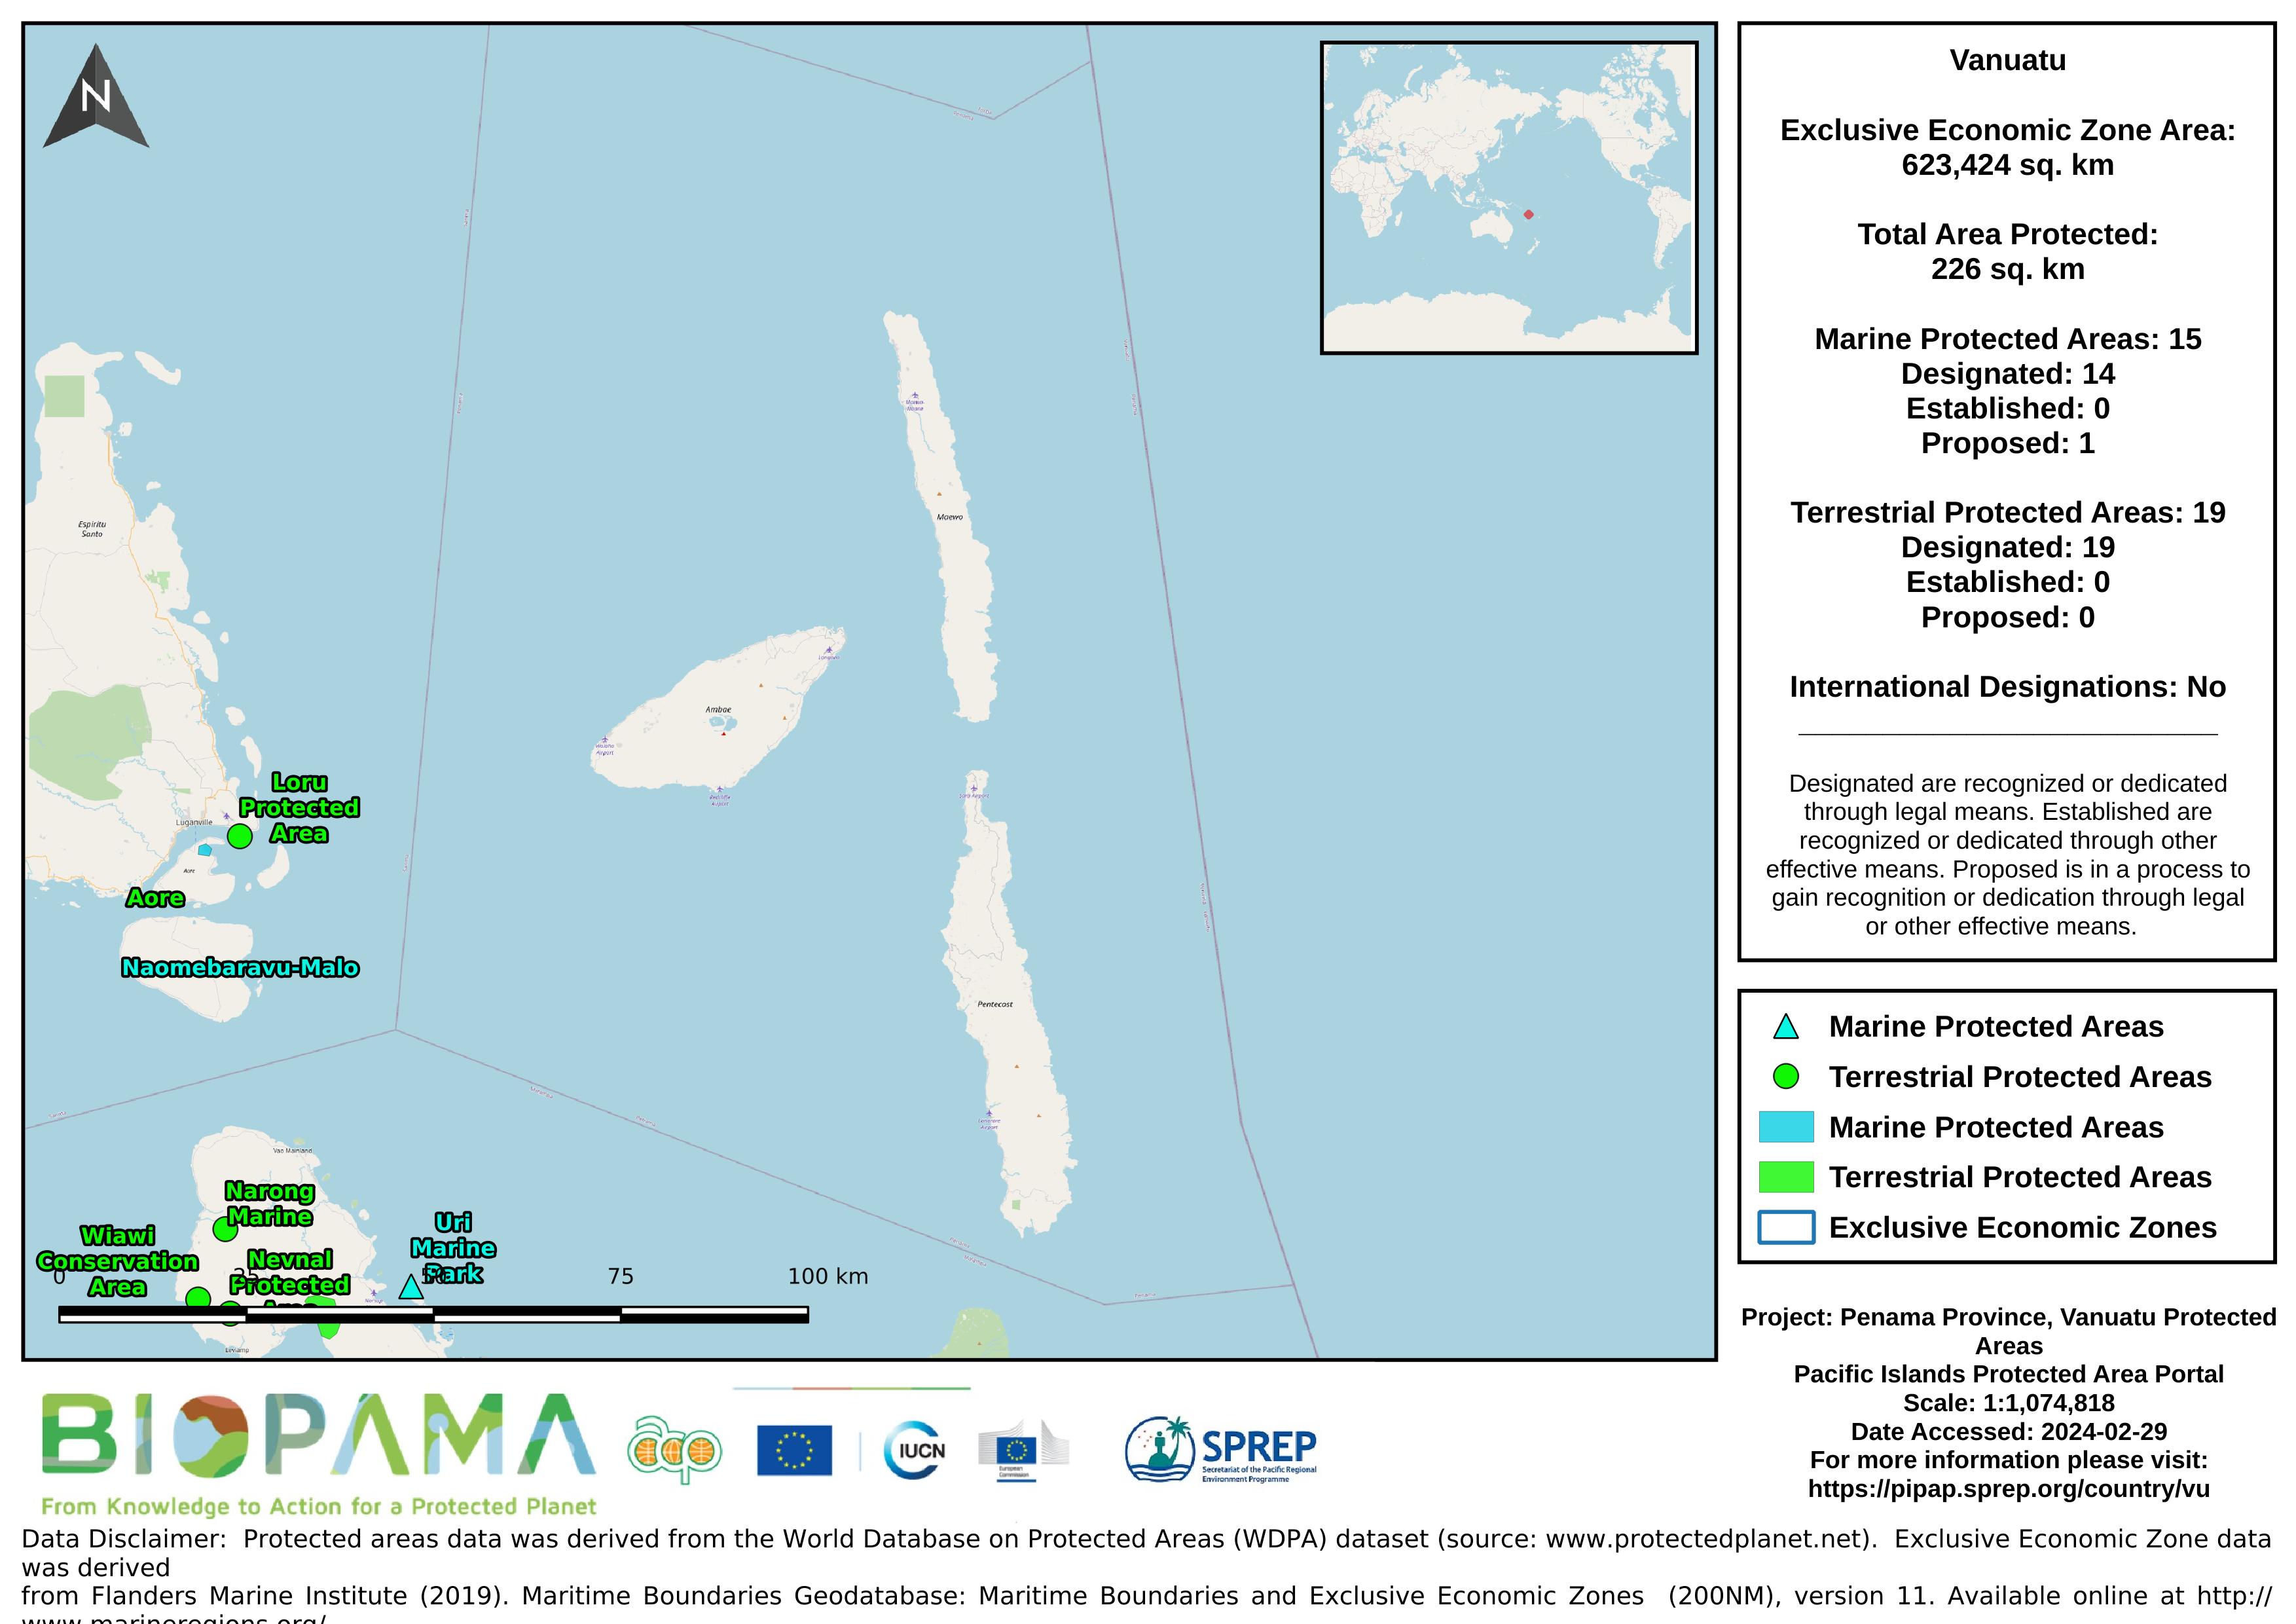
Map of the protected areas for Penama Province, Vanuatu with country-level summary statistics on the amount of area under protection, count for each type of protected area (terrestrial or marine), and the count of their designation.
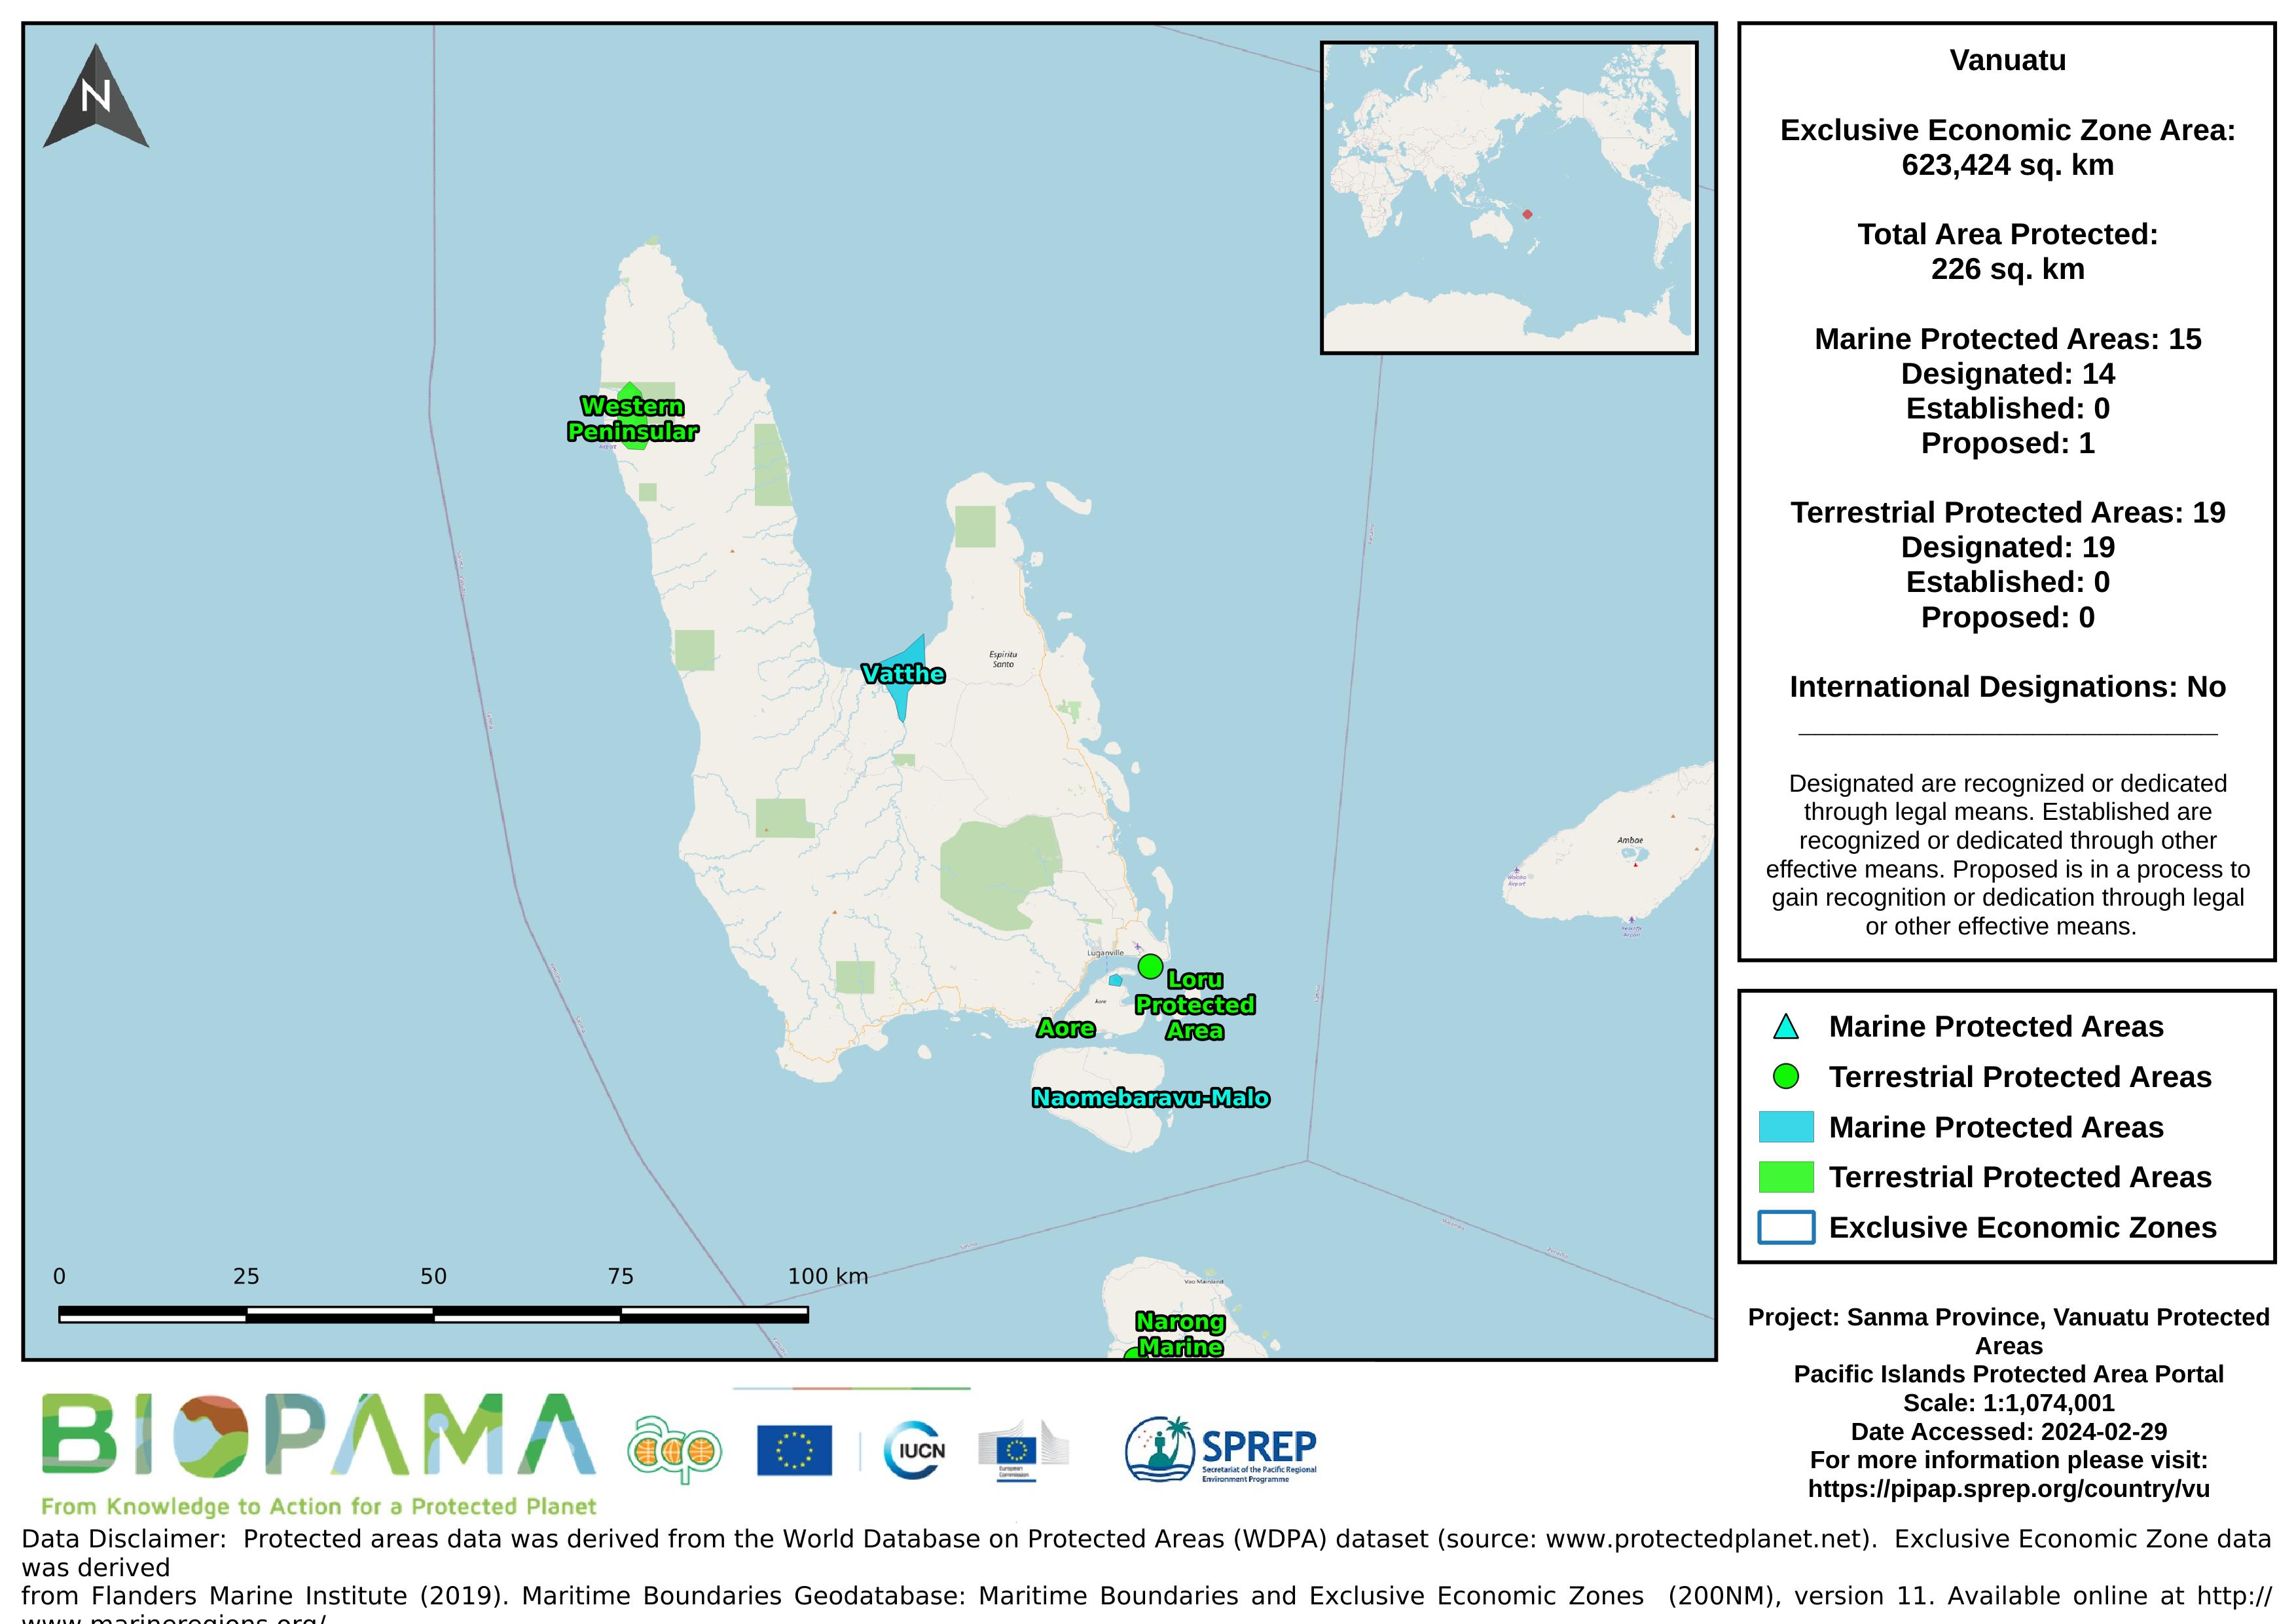
Map of the protected areas for Sanma Province, Vanuatu with country-level summary statistics on the amount of area under protection, count for each type of protected area (terrestrial or marine), and the count of their designation.
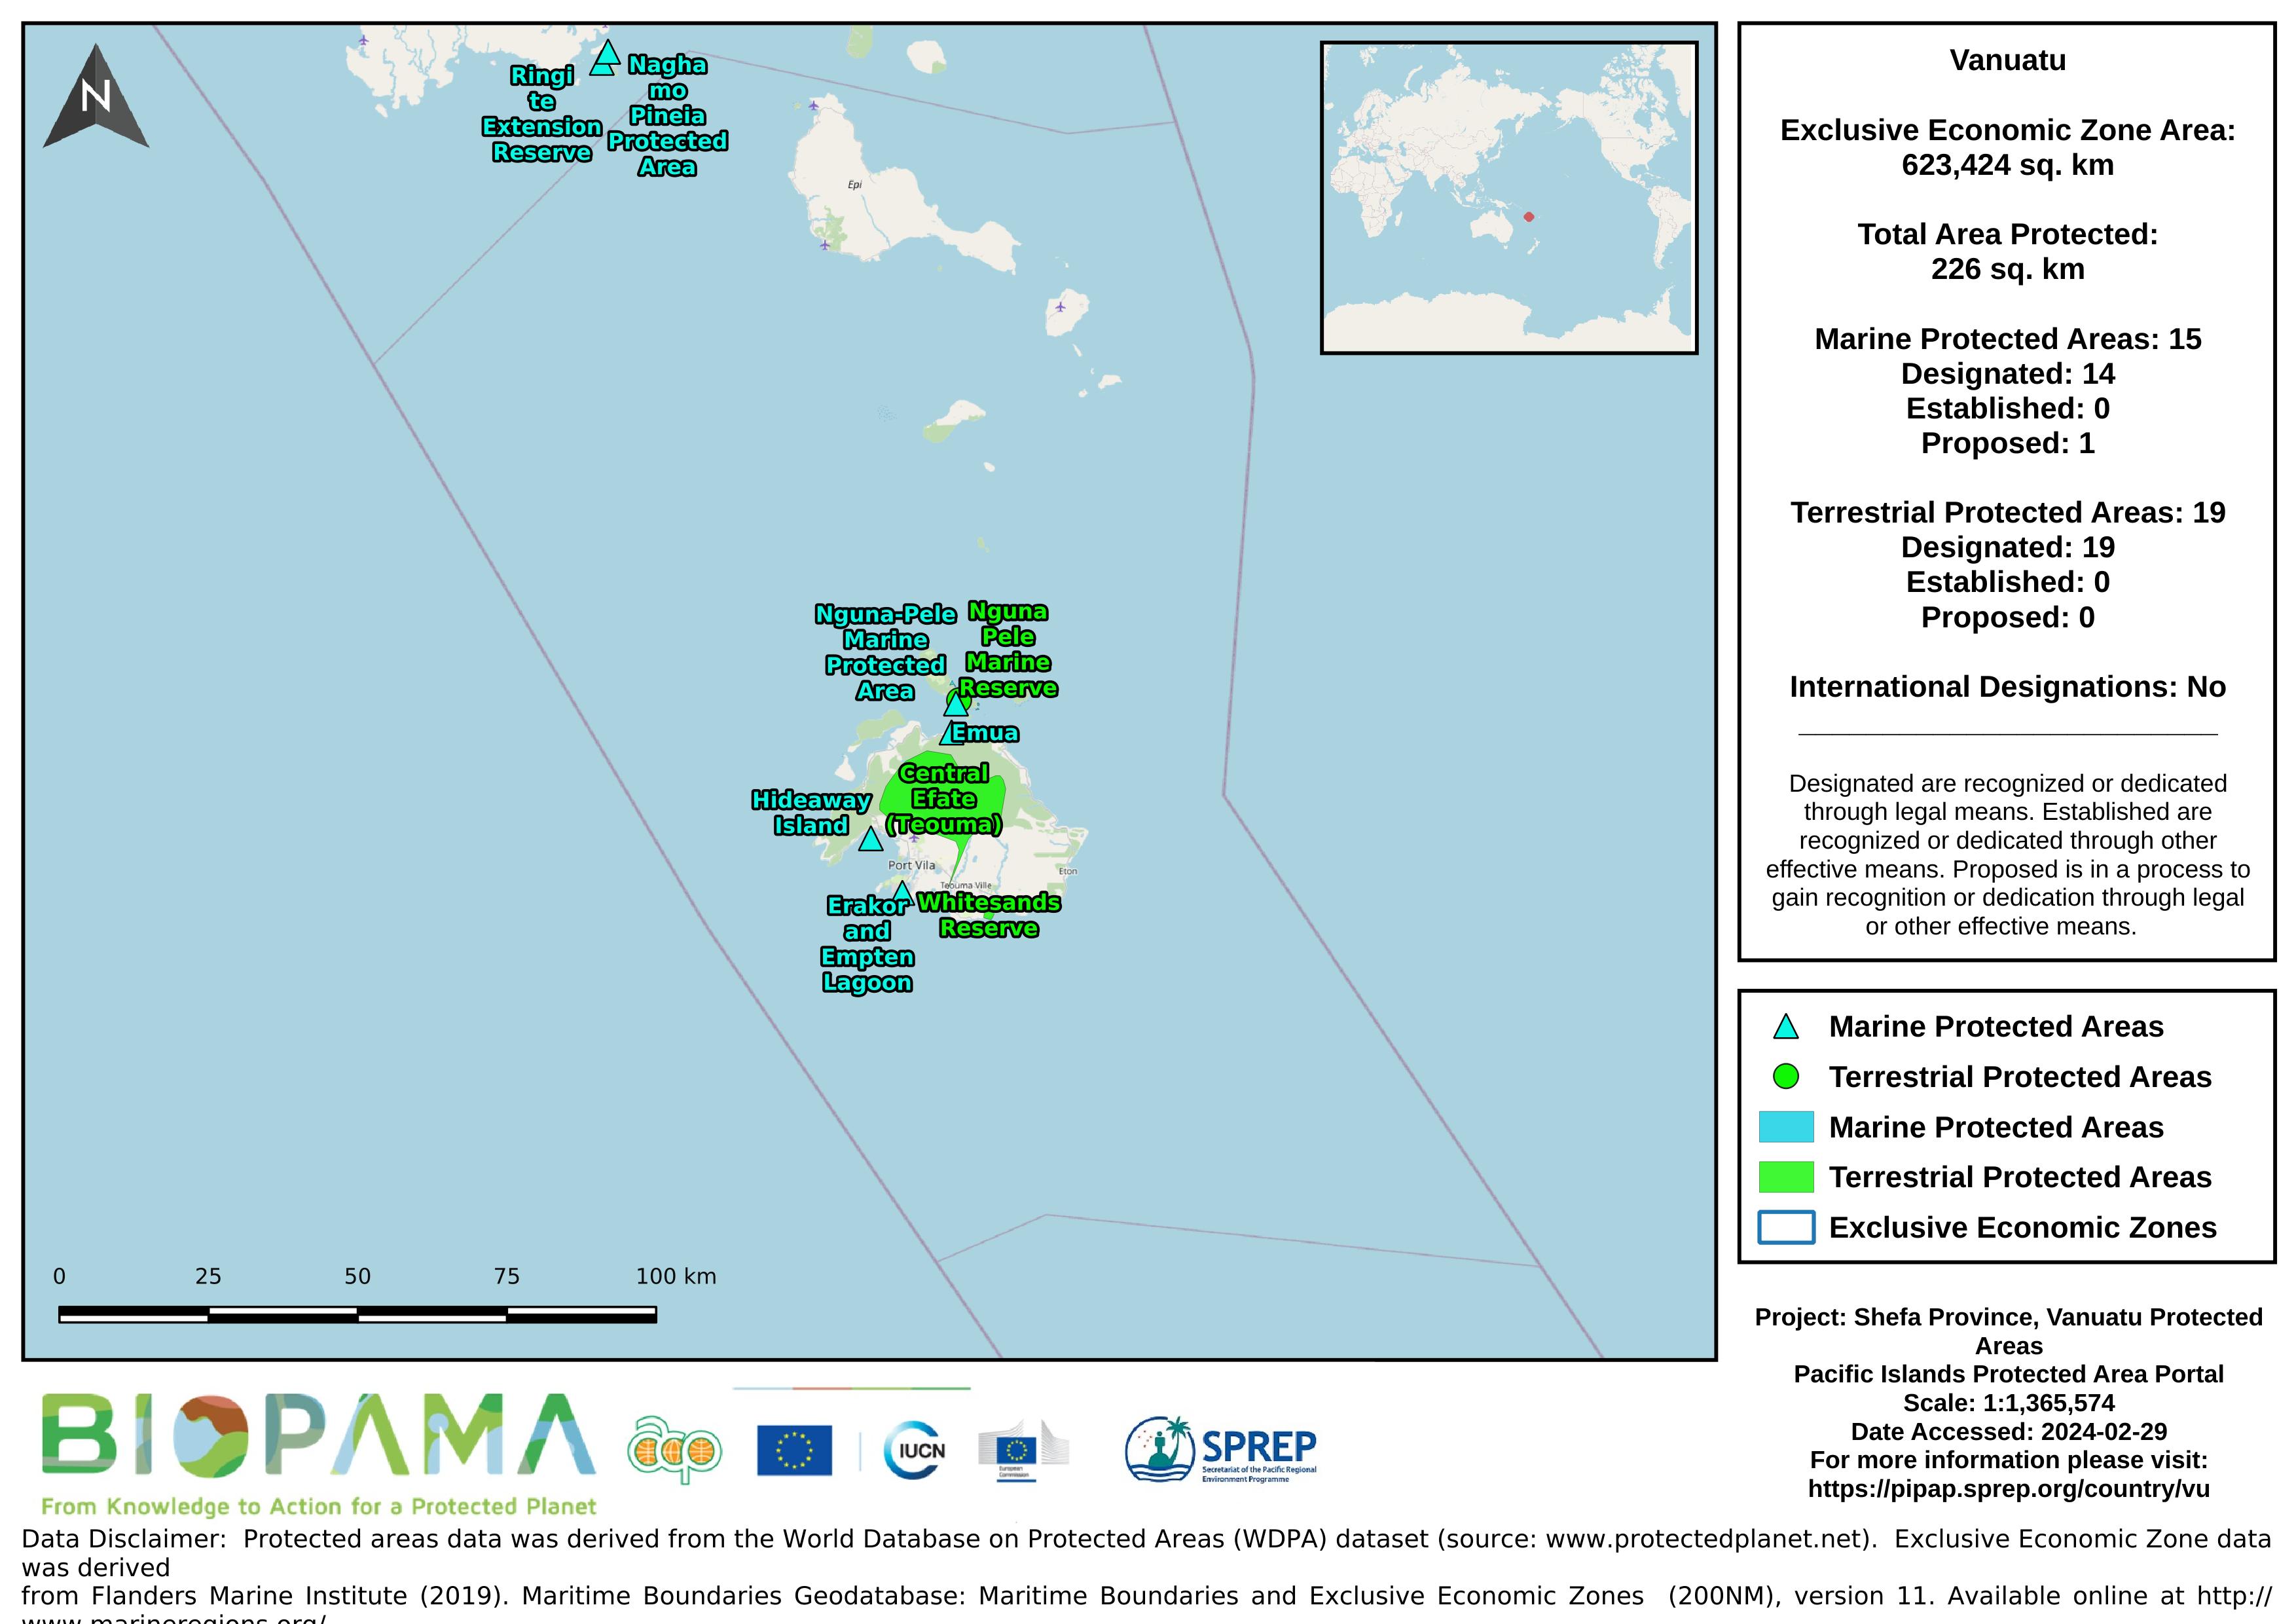
Map of the protected areas for Shefa Province, Vanuatu with country-level summary statistics on the amount of area under protection, count for each type of protected area (terrestrial or marine), and the count of their designation.
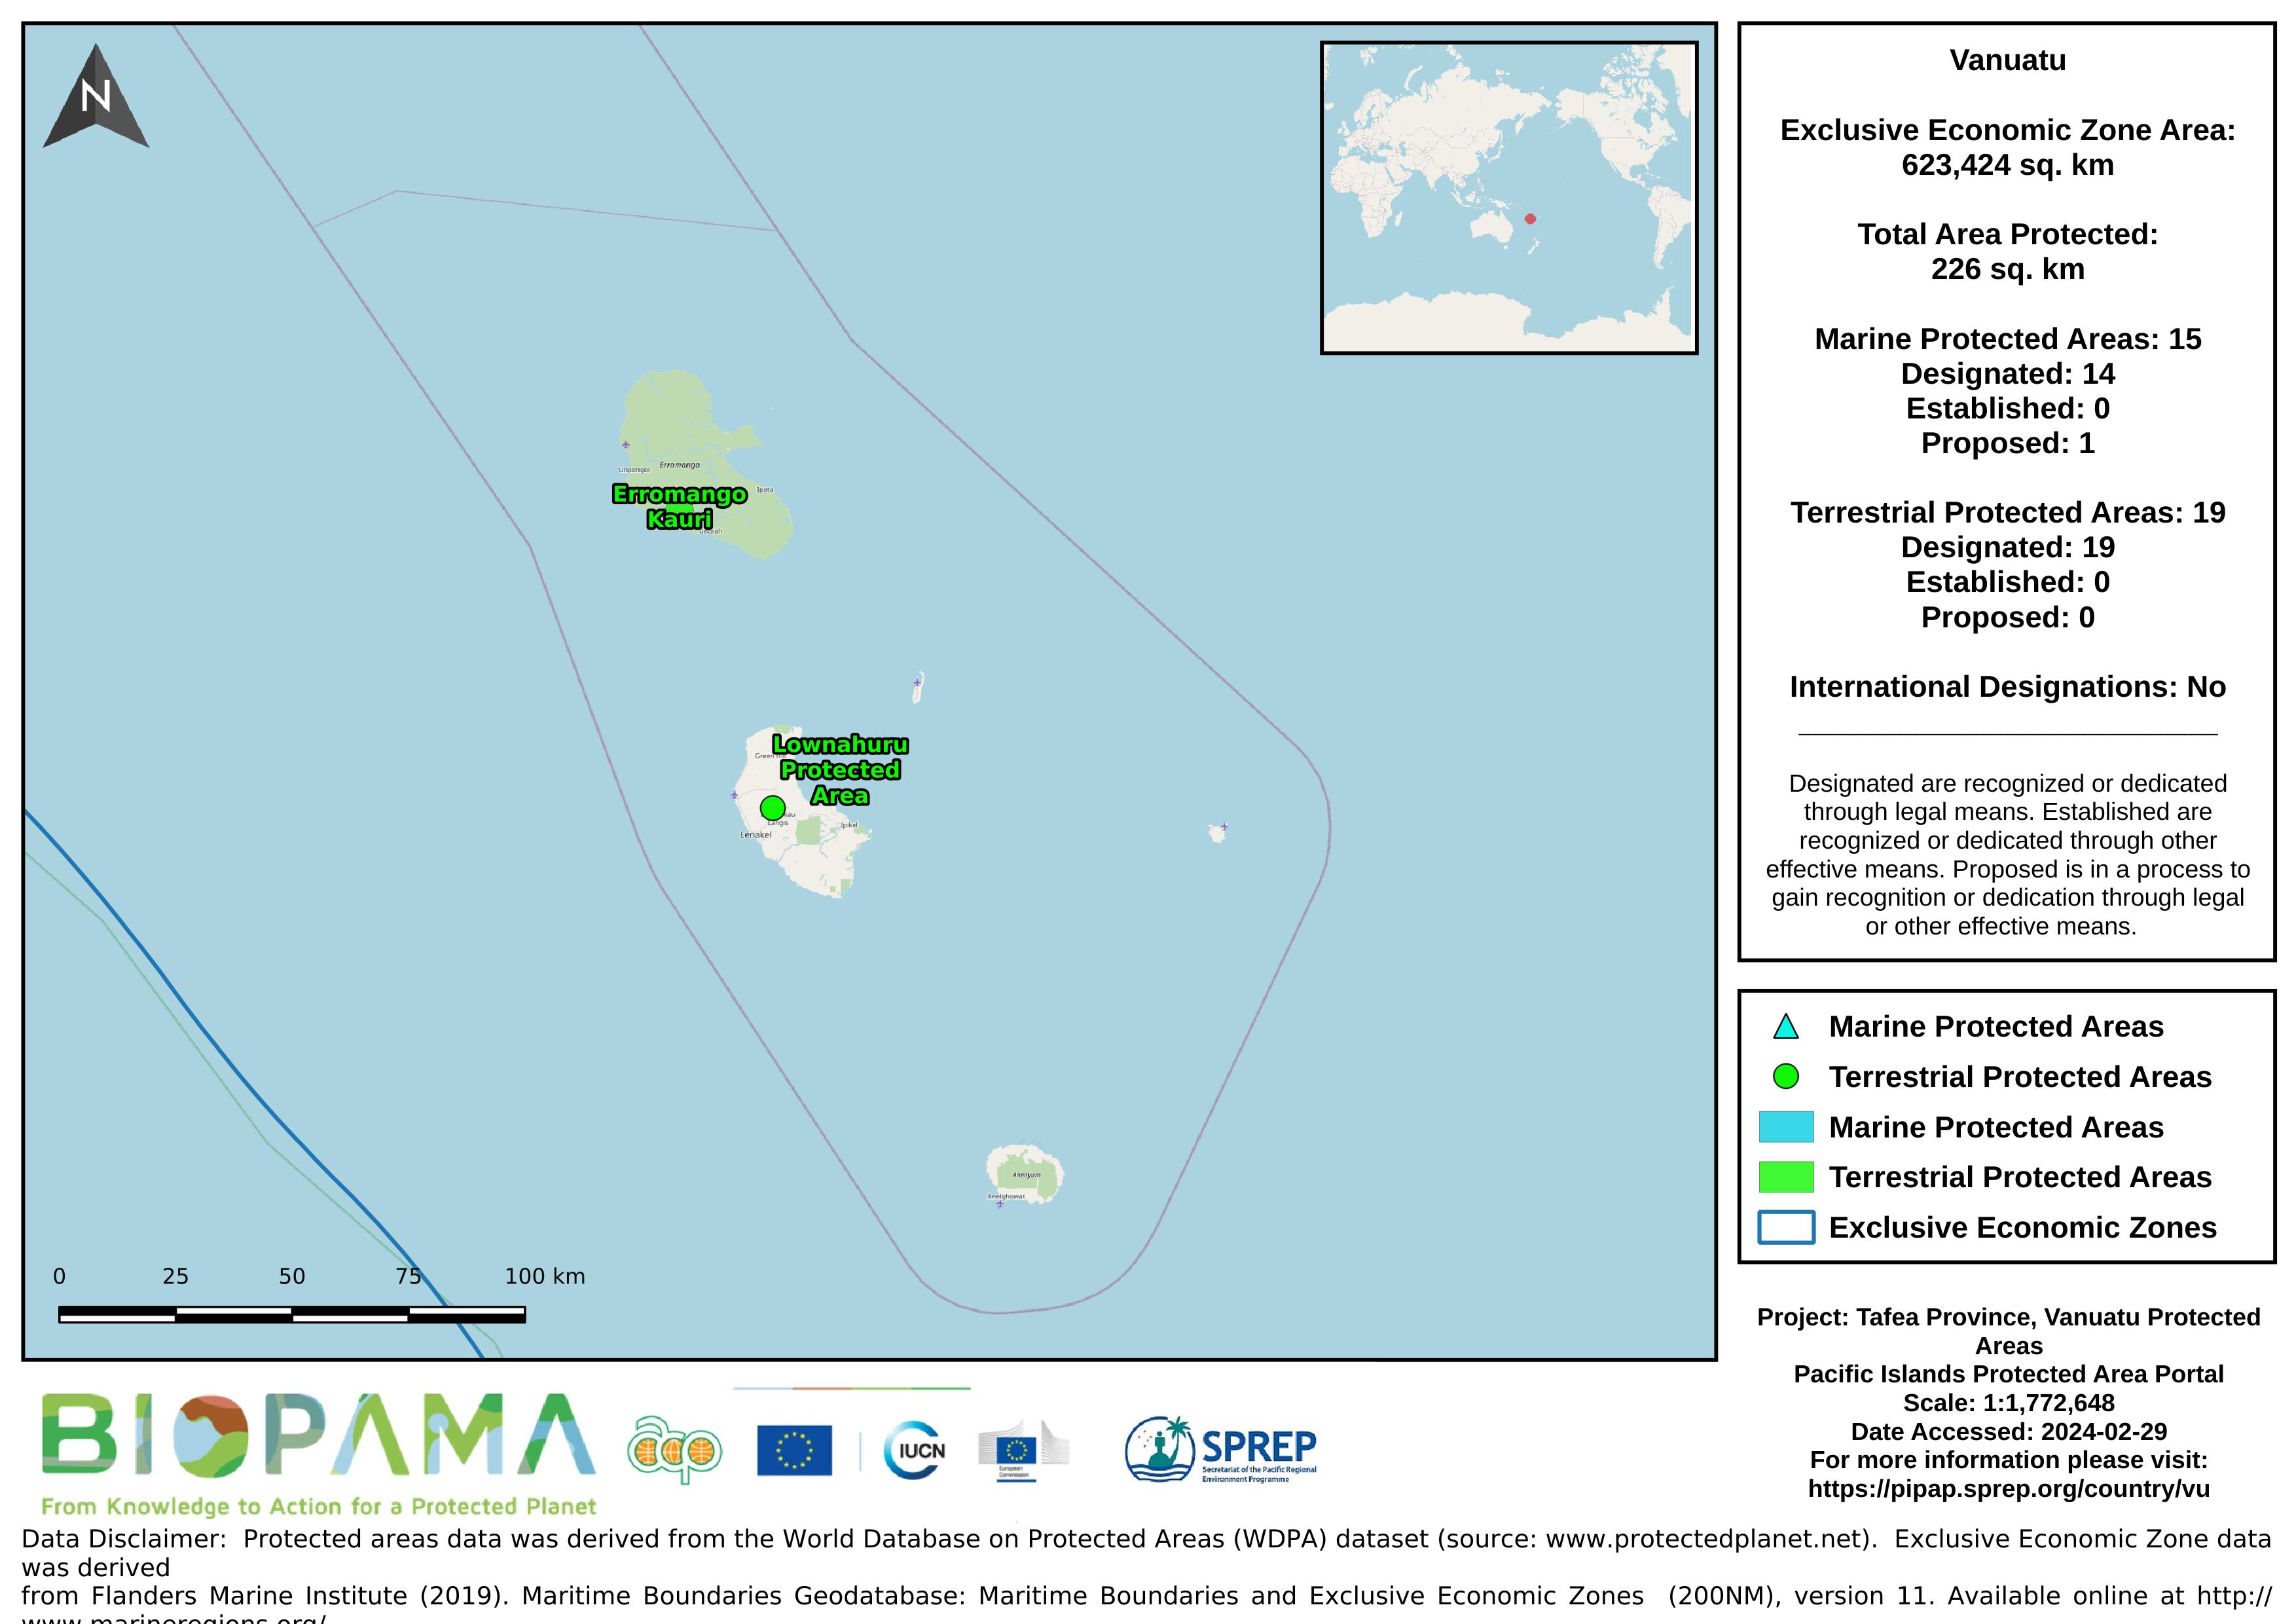
Map of the protected areas for Tafea Province, Vanuatu with country-level summary statistics on the amount of area under protection, count for each type of protected area (terrestrial or marine), and the count of their designation.
Map of the protected areas for Torba Province, Vanuatu with country-level summary statistics on the amount of area under protection, count for each type of protected area (terrestrial or marine), and the count of their designation.
Raster data representing the mean levels of calcite in µmol/m3 for the surface water layer. The data are available for global-scale applications at a spatial resolution of 5 arcmin (approximately 9.2 km at the equator).
Marine data layers for present conditions were produced with climate data describing monthly averages for the period 2000–2014, obtained from pre-processed global ocean re-analyses combining satellite and in situ observations at regular two- and three-dimensional spatial grids.
Raster data representing the mean levels of current velocities in meters/second for the surface water layer. The data are available for global-scale applications at a spatial resolution of 5 arcmin (approximately 9.2 km at the equator).
Marine data layers for present conditions were produced with climate data describing monthly averages for the period 2000–2014, obtained from pre-processed global ocean re-analyses combining satellite and in situ observations at regular two- and three-dimensional spatial grids.
Raster data representing the mean levels of iron in µmol/m3 for the surface water layer. The data are available for global-scale applications at a spatial resolution of 5 arcmin (approximately 9.2 km at the equator).
Marine data layers for present conditions were produced with climate data describing monthly averages for the period 2000–2014, obtained from pre-processed global ocean re-analyses combining satellite and in situ observations at regular two- and three-dimensional spatial grids.
Raster data representing the mean levels of pH for the surface water layer. The data are available for global-scale applications at a spatial resolution of 5 arcmin (approximately 9.2 km at the equator).
Marine data layers for present conditions were produced with climate data describing monthly averages for the period 2000–2014, obtained from pre-processed global ocean re-analyses combining satellite and in situ observations at regular two- and three-dimensional spatial grids.
Raster data representing the mean levels of photosynthetically active radiation (PAR) in E/m2/year for the surface water layer. The data are available for global-scale applications at a spatial resolution of 5 arcmin (approximately 9.2 km at the equator).
Marine data layers for present conditions were produced with climate data describing monthly averages for the period 2000–2014, obtained from pre-processed global ocean re-analyses combining satellite and in situ observations at regular two- and three-dimensional spatial grids.