The WDPA User Manual provides information and guidance about the data held within the WDPA, including its history, how it is collected, managed and distributed, and how it should be interpreted and used for analyses and research. The Manual has been prepared for WDPA data providers and users. It is structured in 4 sections and includes 6 appendices.
The Protected Areas Working Group (PAWG) of the Pacific Islands Round Table for Nature Conservation recommended a forum to better connect a diverse range of people and their work relating to protected and conserved areas. To increase efficacy with respect to gaining momentum with communications and conservation work, the Pacific Islands Protected Area Portal (PIPAP) was launched.
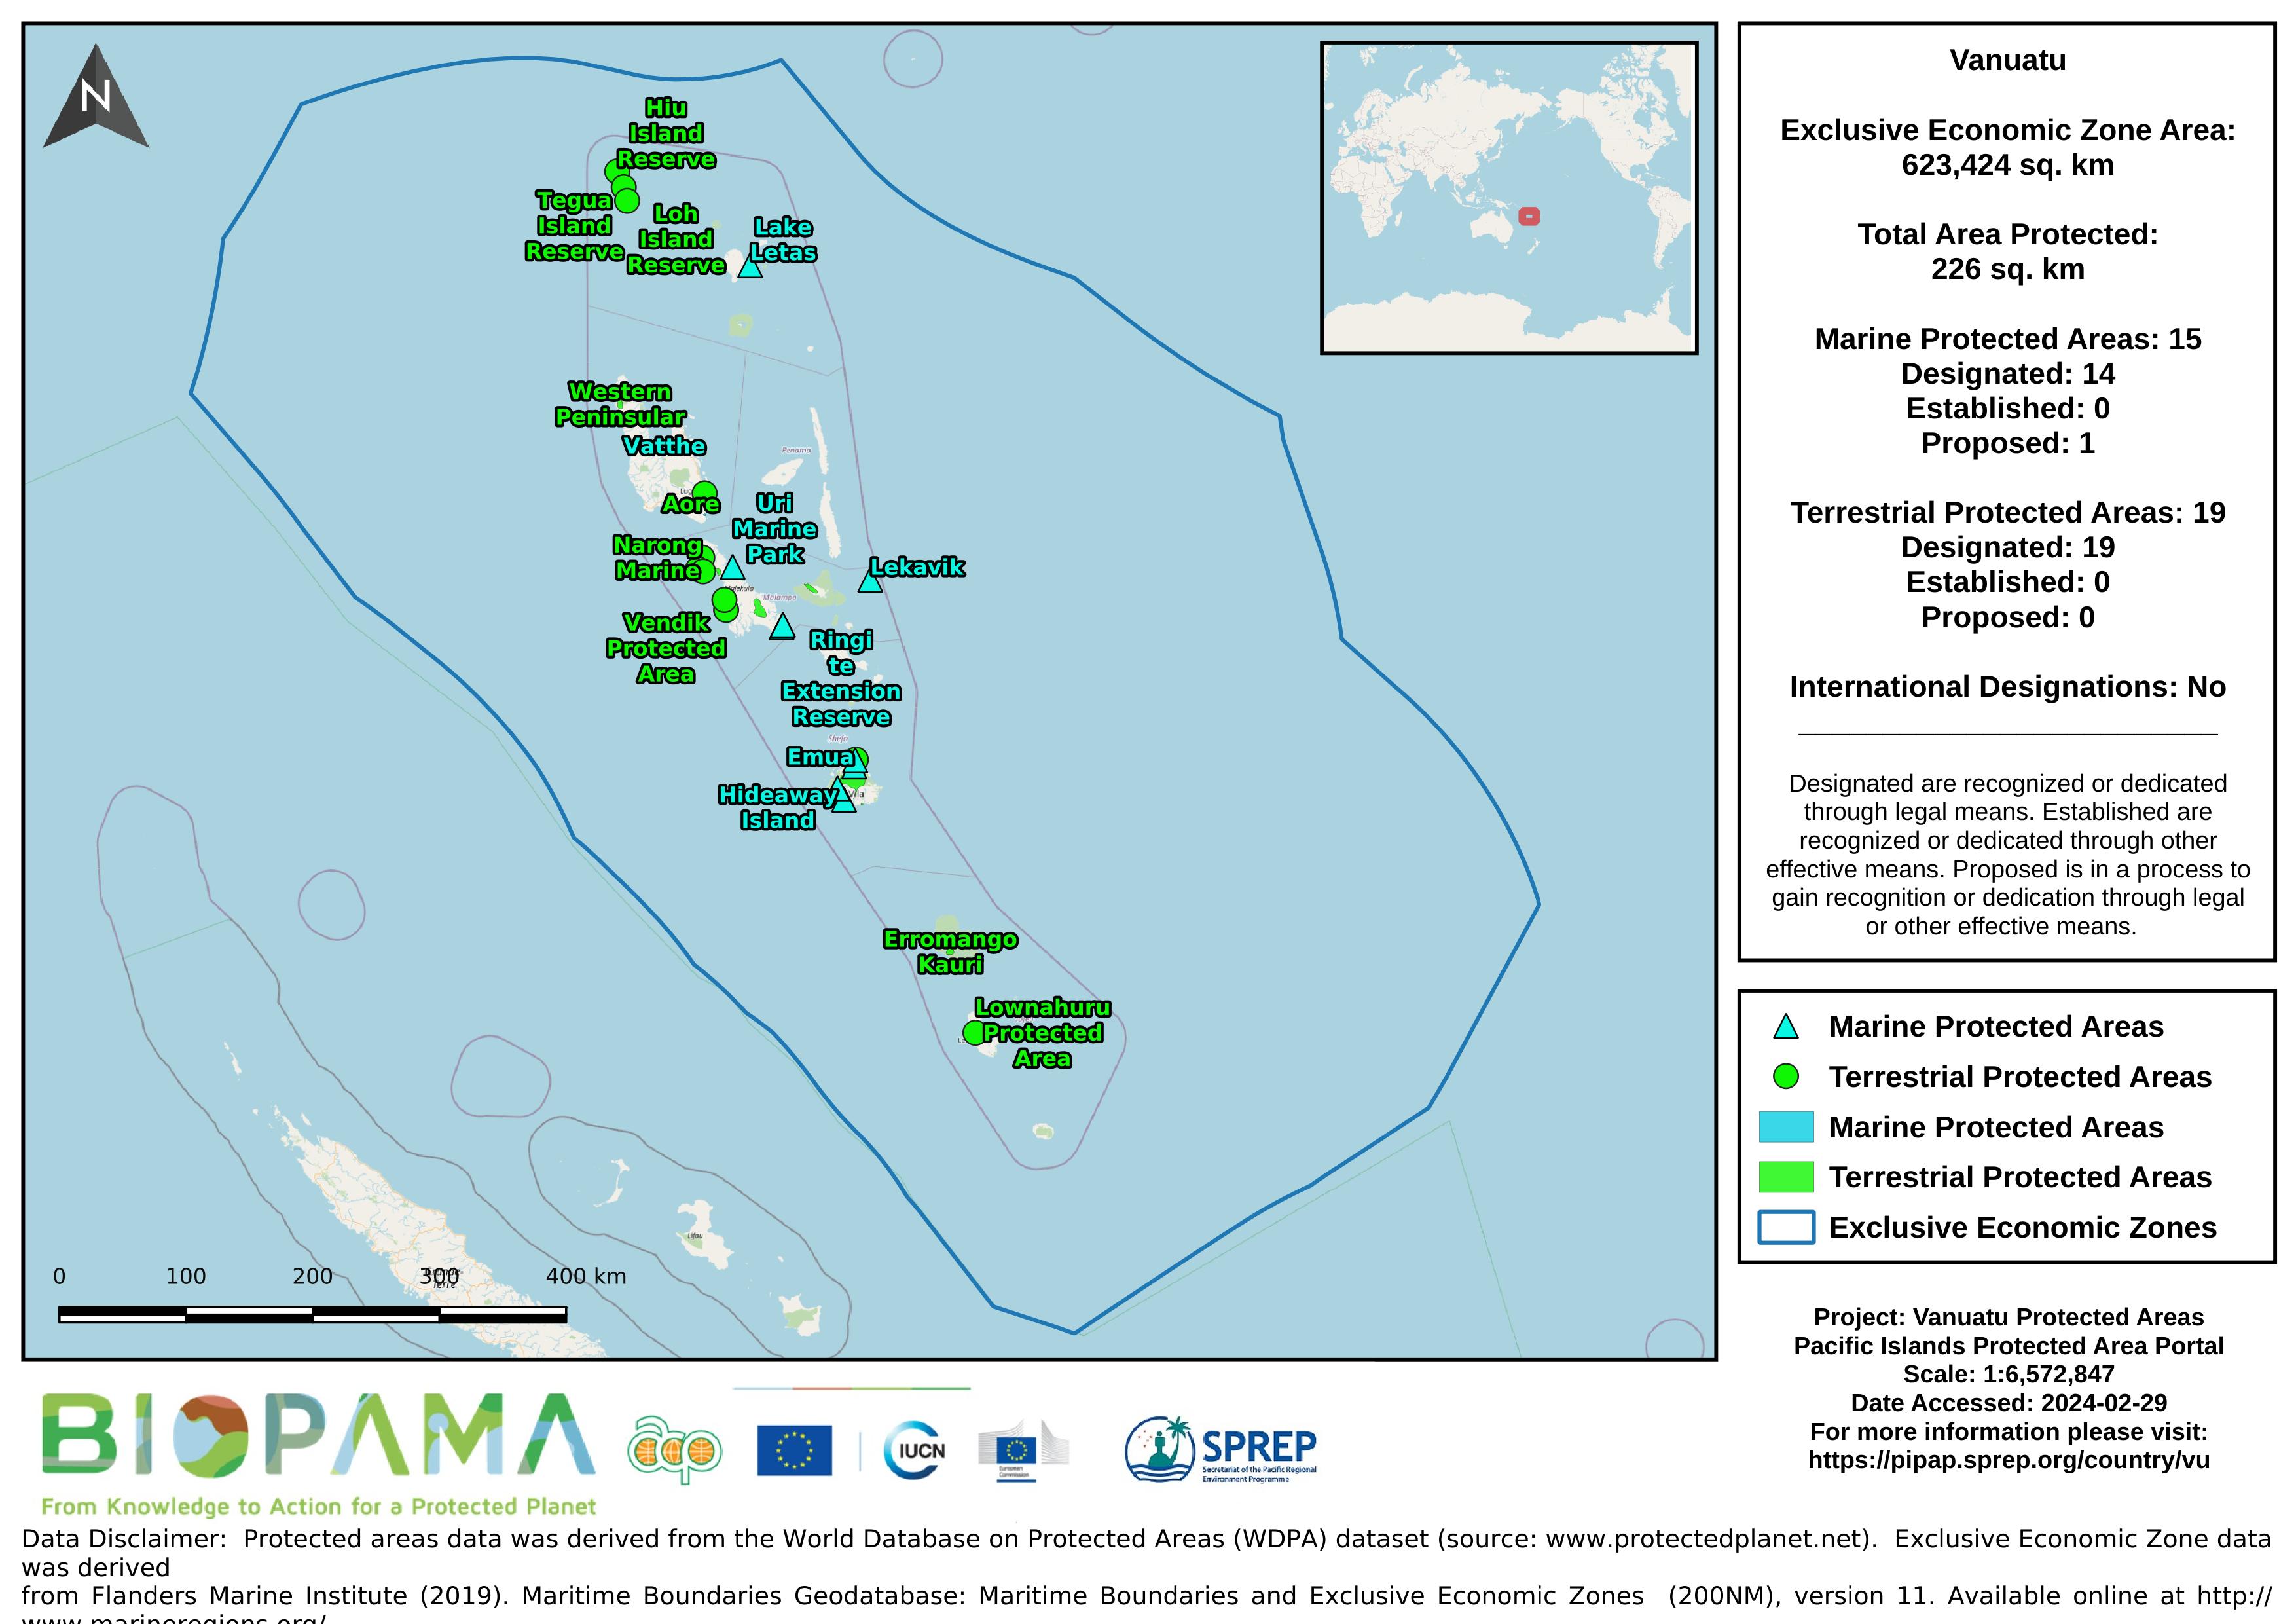
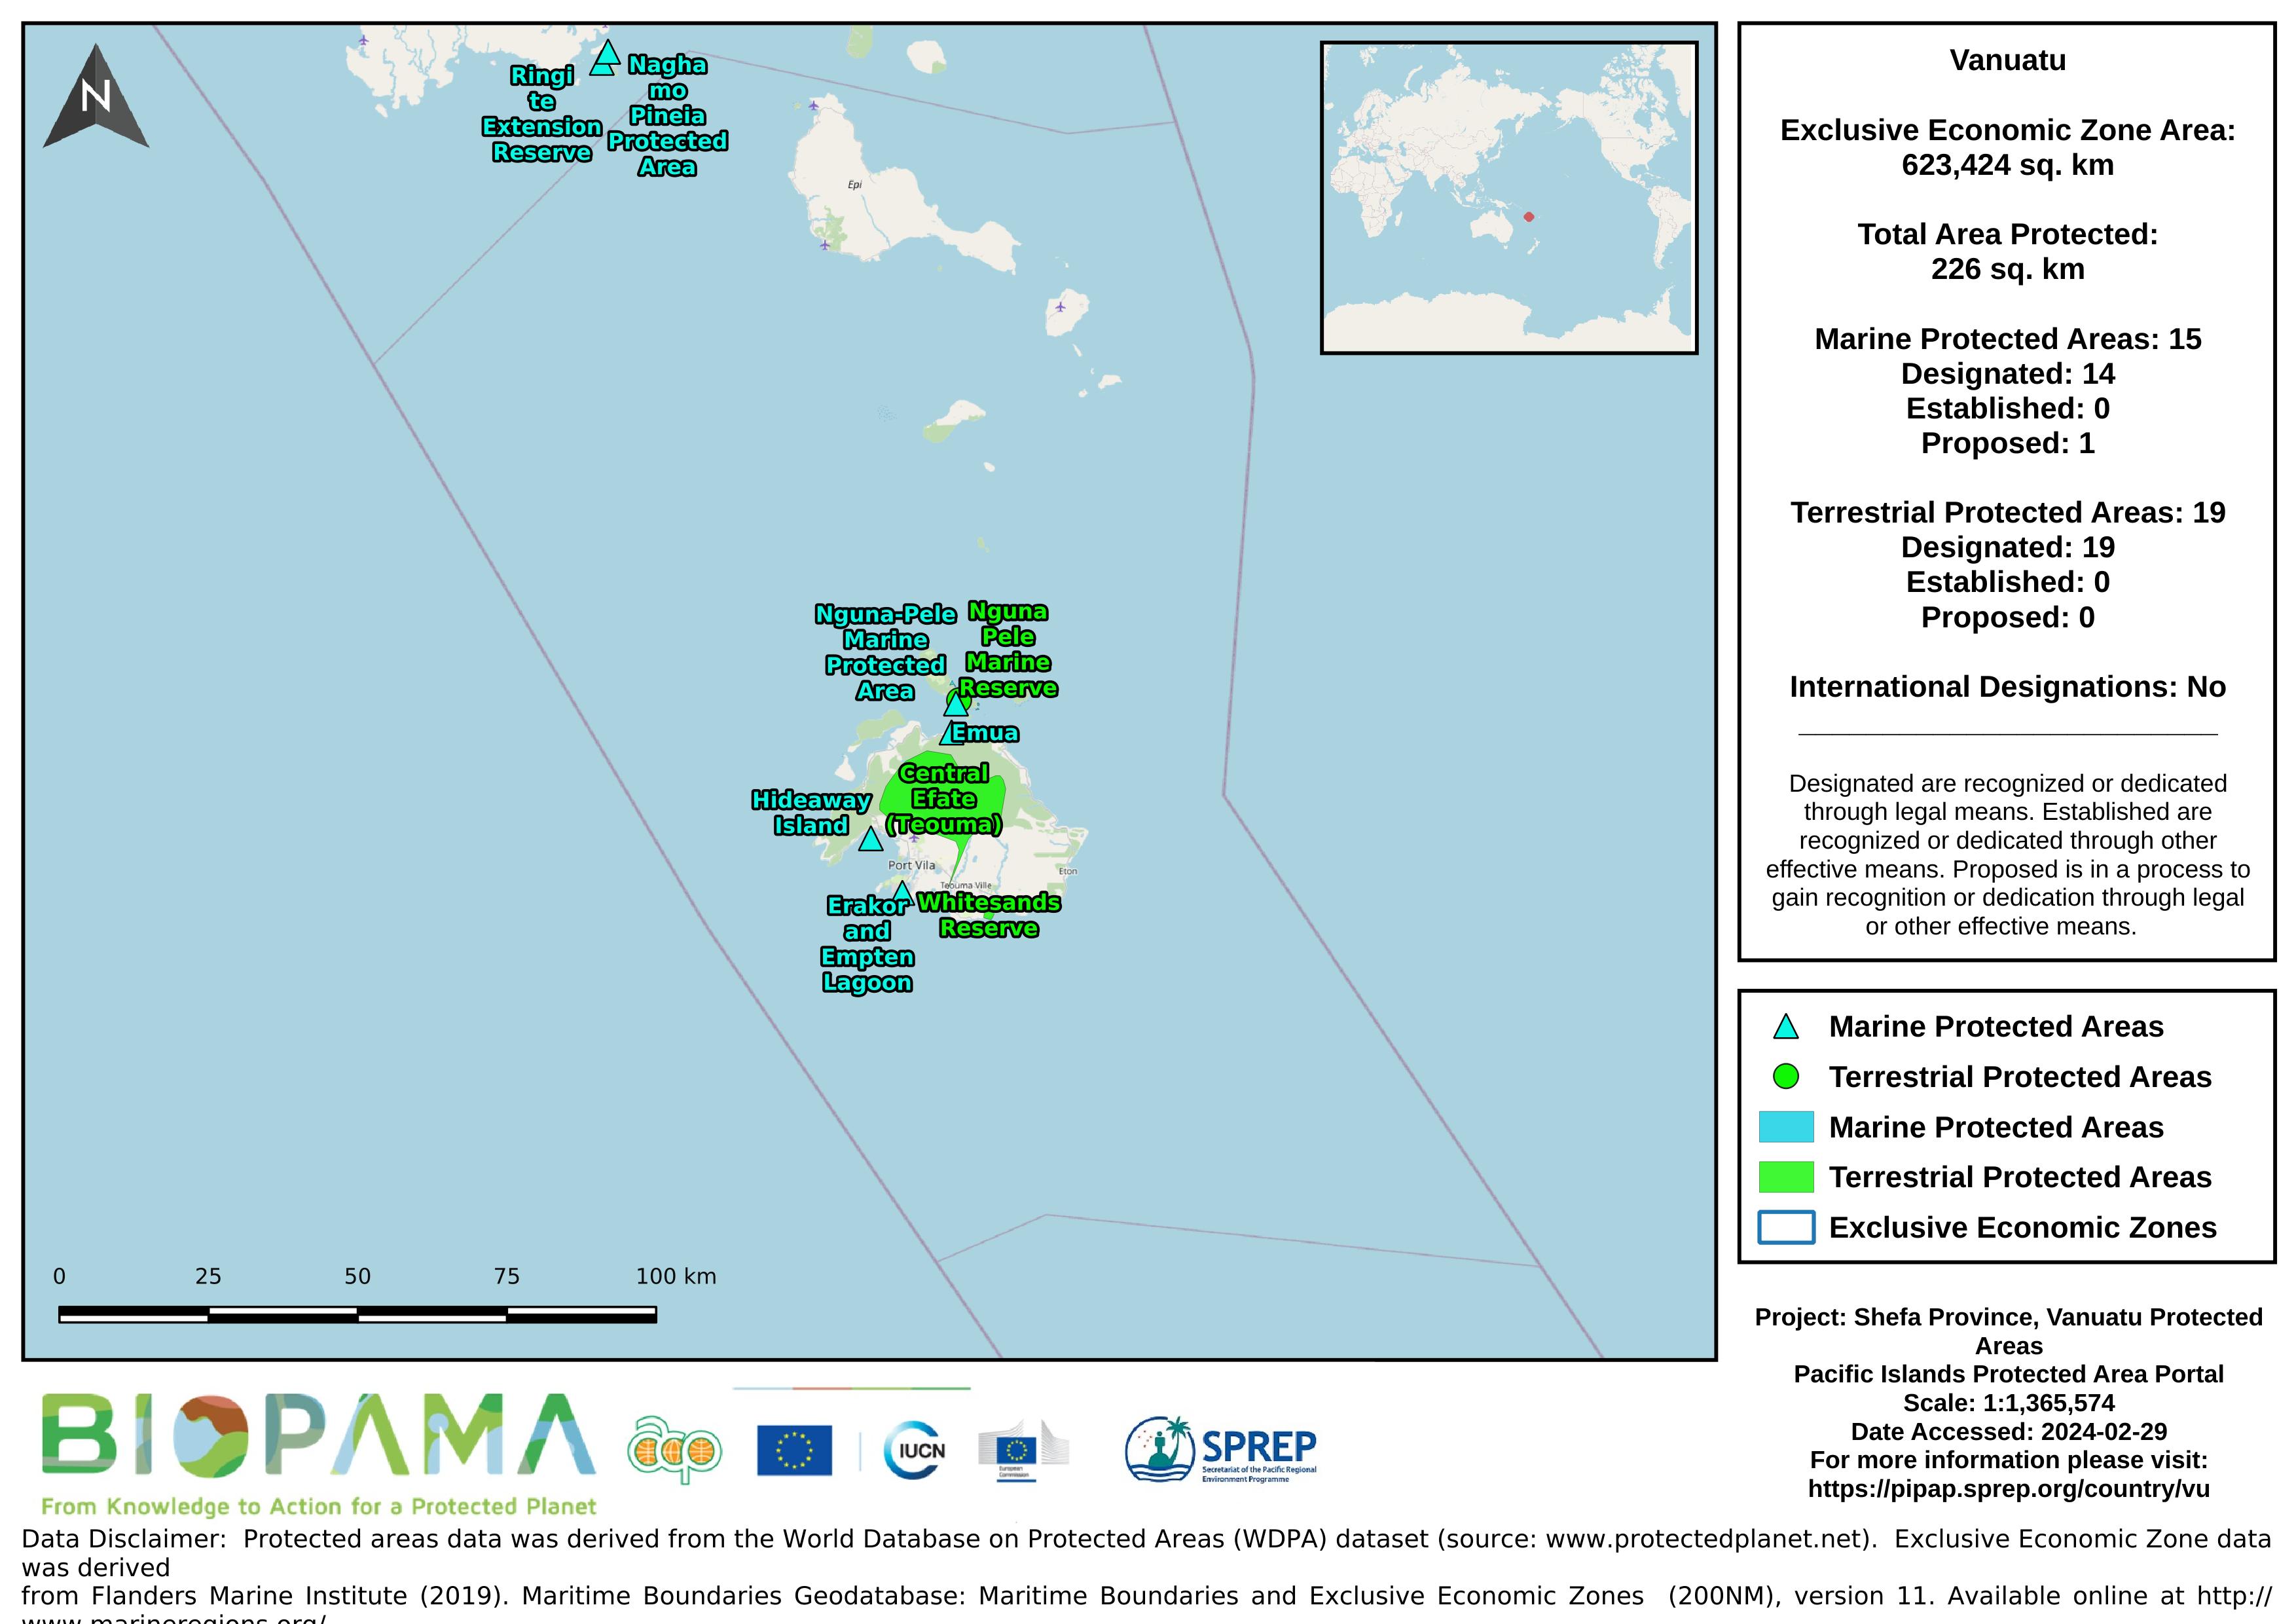
Map of the protected areas for Vanuatu with country-level summary statistics on the amount of area under protection, count for each type of protected area (terrestrial or marine), and the count of their designation.
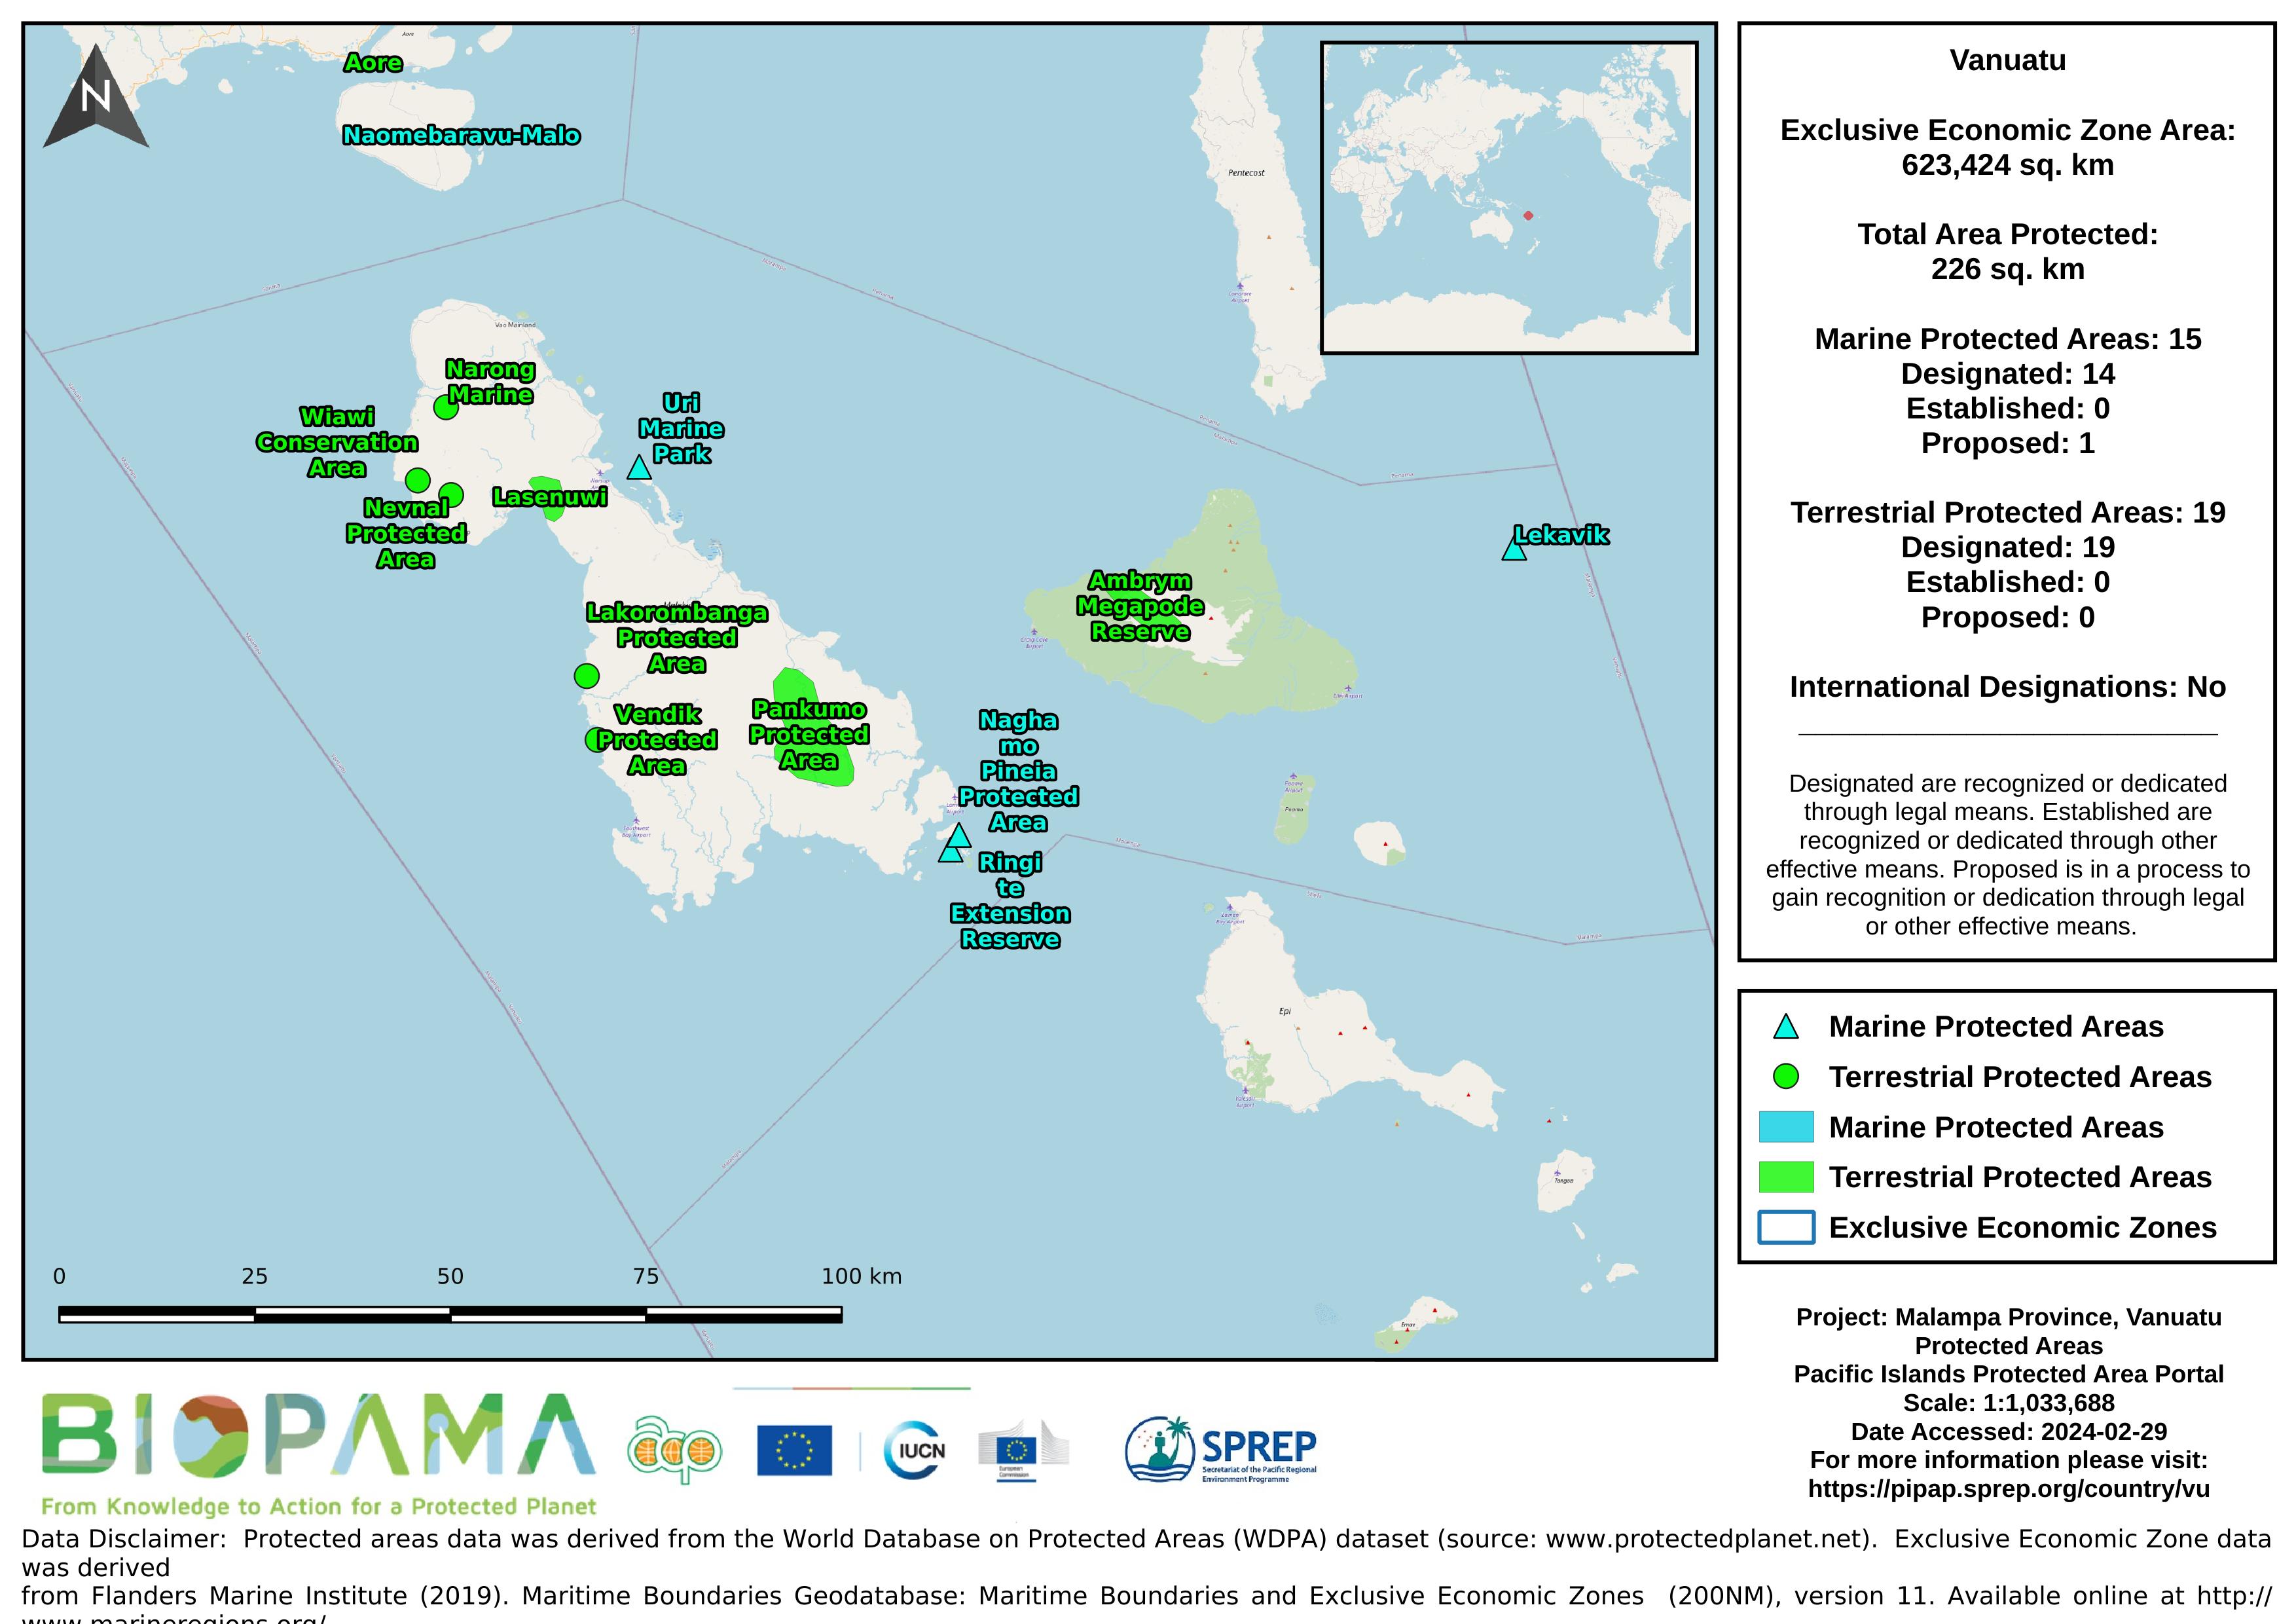
Map of the protected areas for Malampa Province, Vanuatu with country-level summary statistics on the amount of area under protection, count for each type of protected area (terrestrial or marine), and the count of their designation.
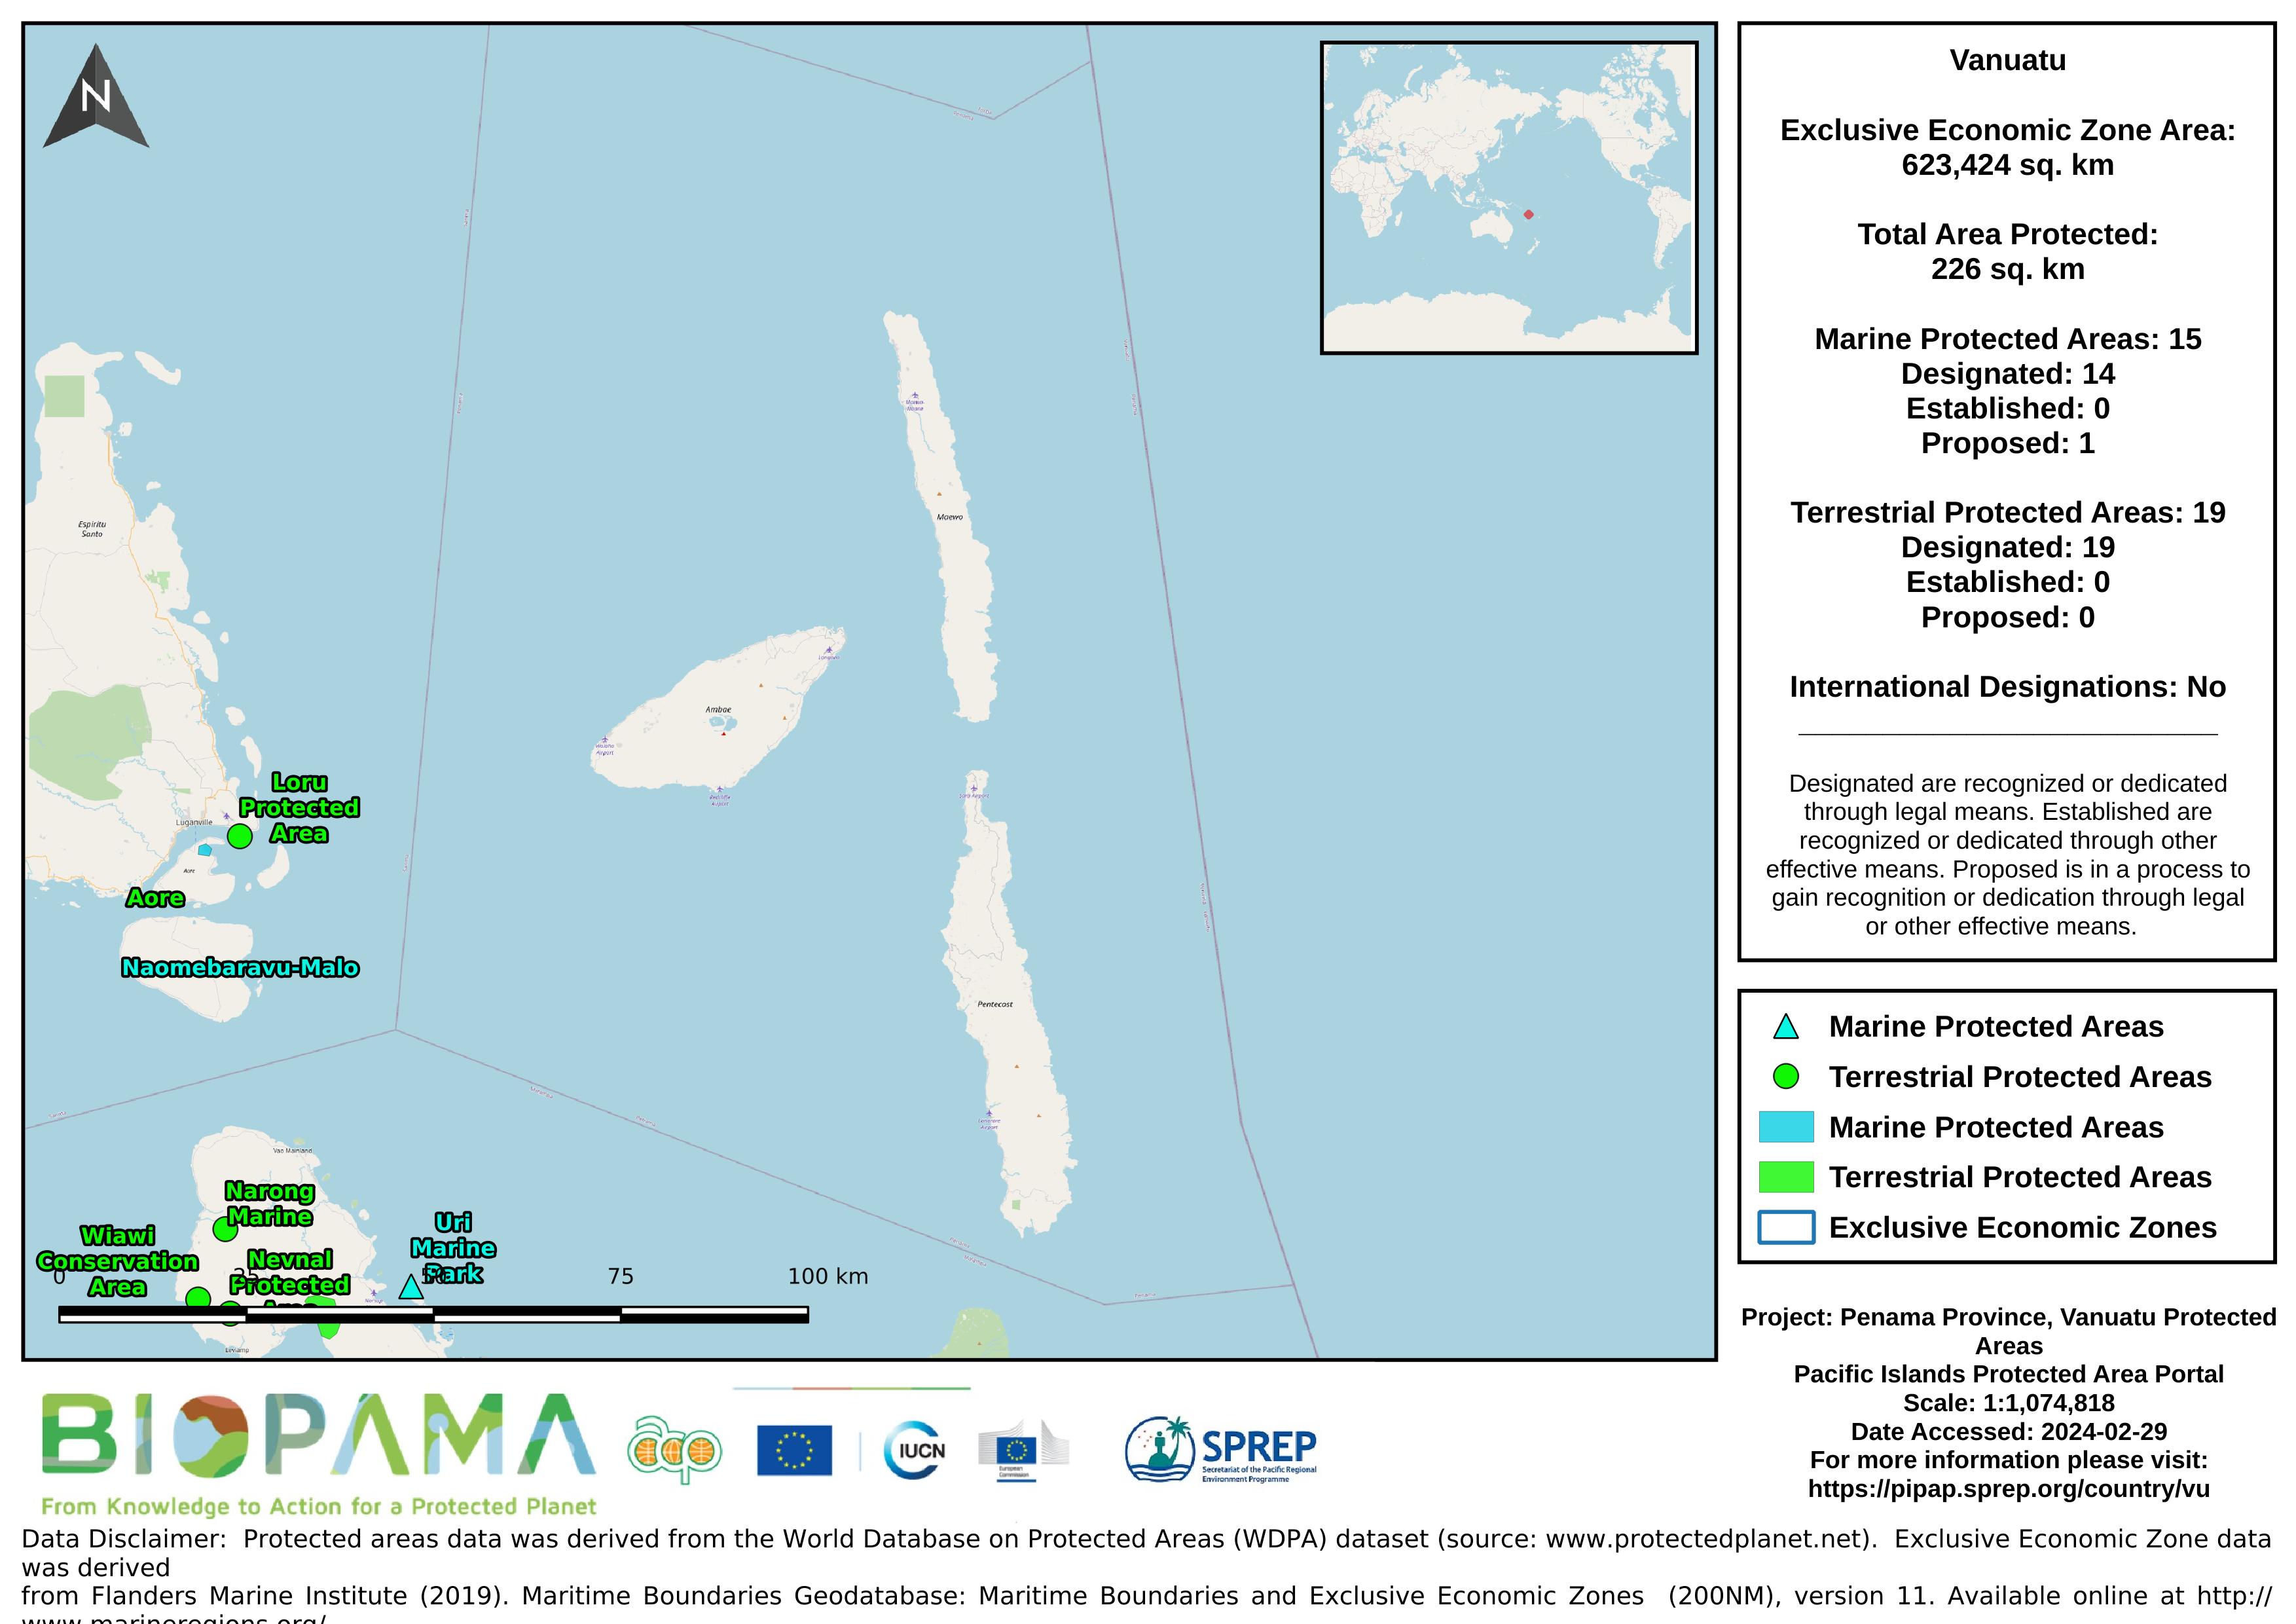
Map of the protected areas for Penama Province, Vanuatu with country-level summary statistics on the amount of area under protection, count for each type of protected area (terrestrial or marine), and the count of their designation.
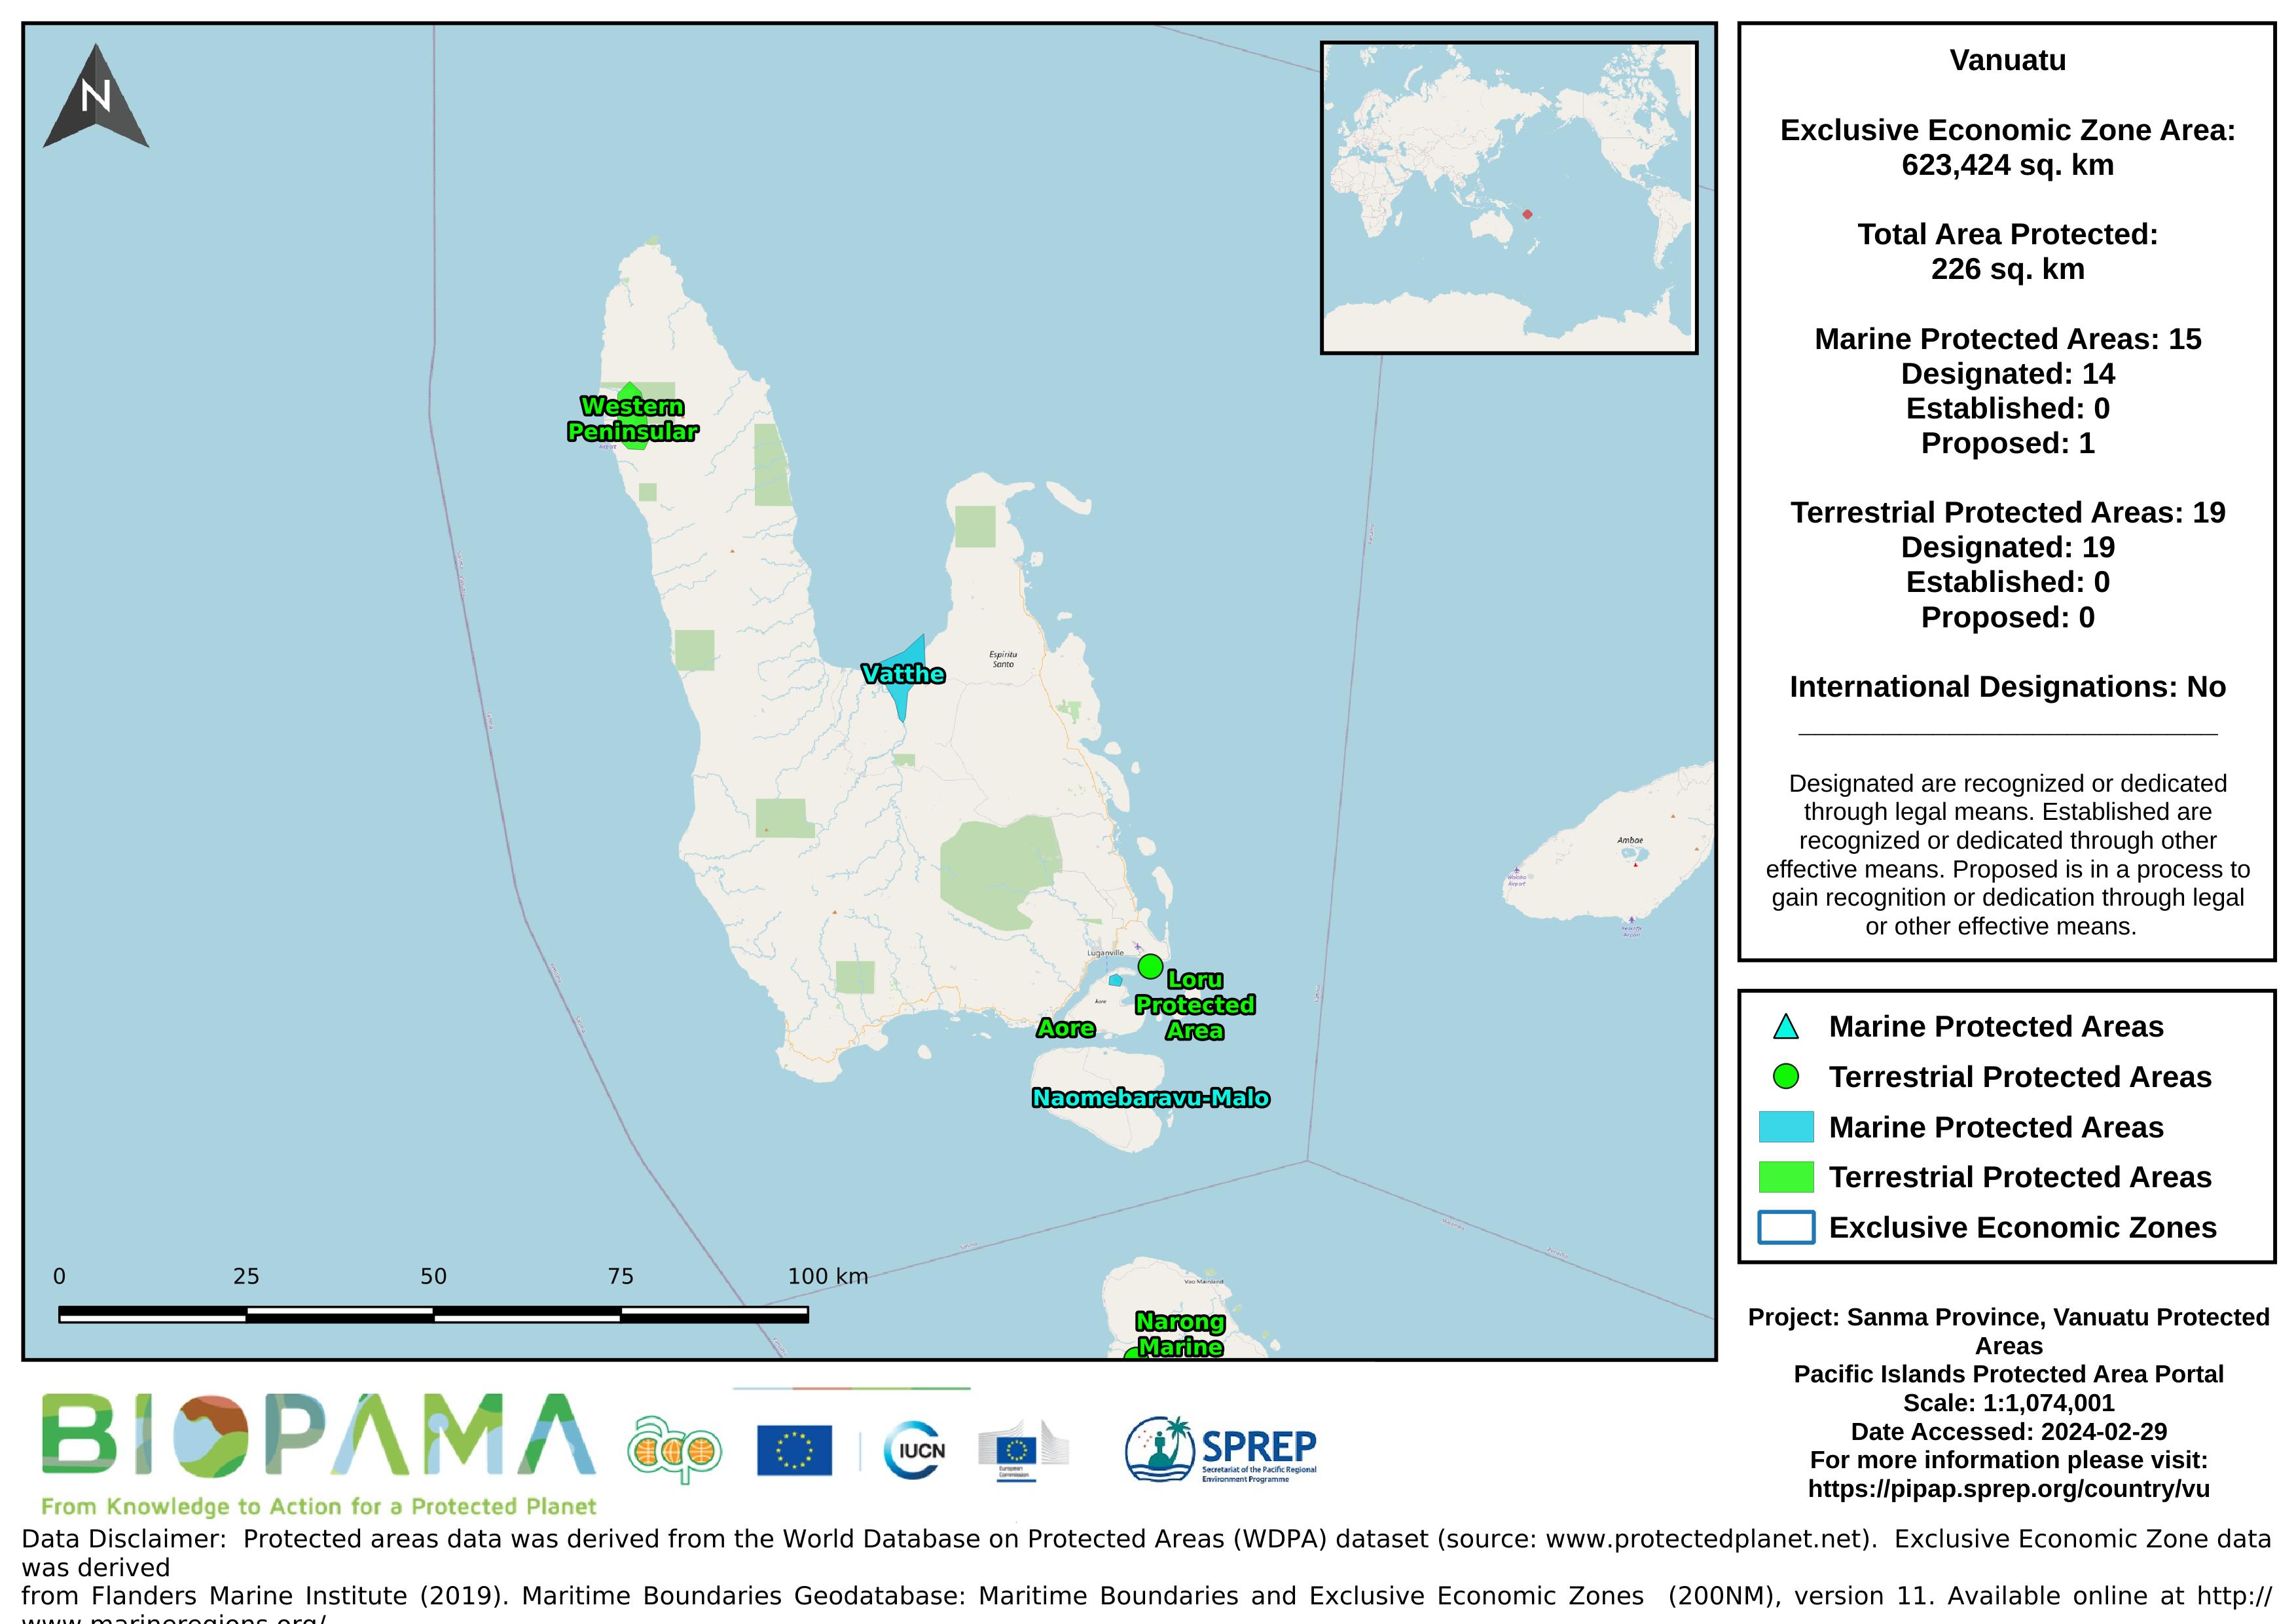
Map of the protected areas for Sanma Province, Vanuatu with country-level summary statistics on the amount of area under protection, count for each type of protected area (terrestrial or marine), and the count of their designation.
Map of the protected areas for Shefa Province, Vanuatu with country-level summary statistics on the amount of area under protection, count for each type of protected area (terrestrial or marine), and the count of their designation.
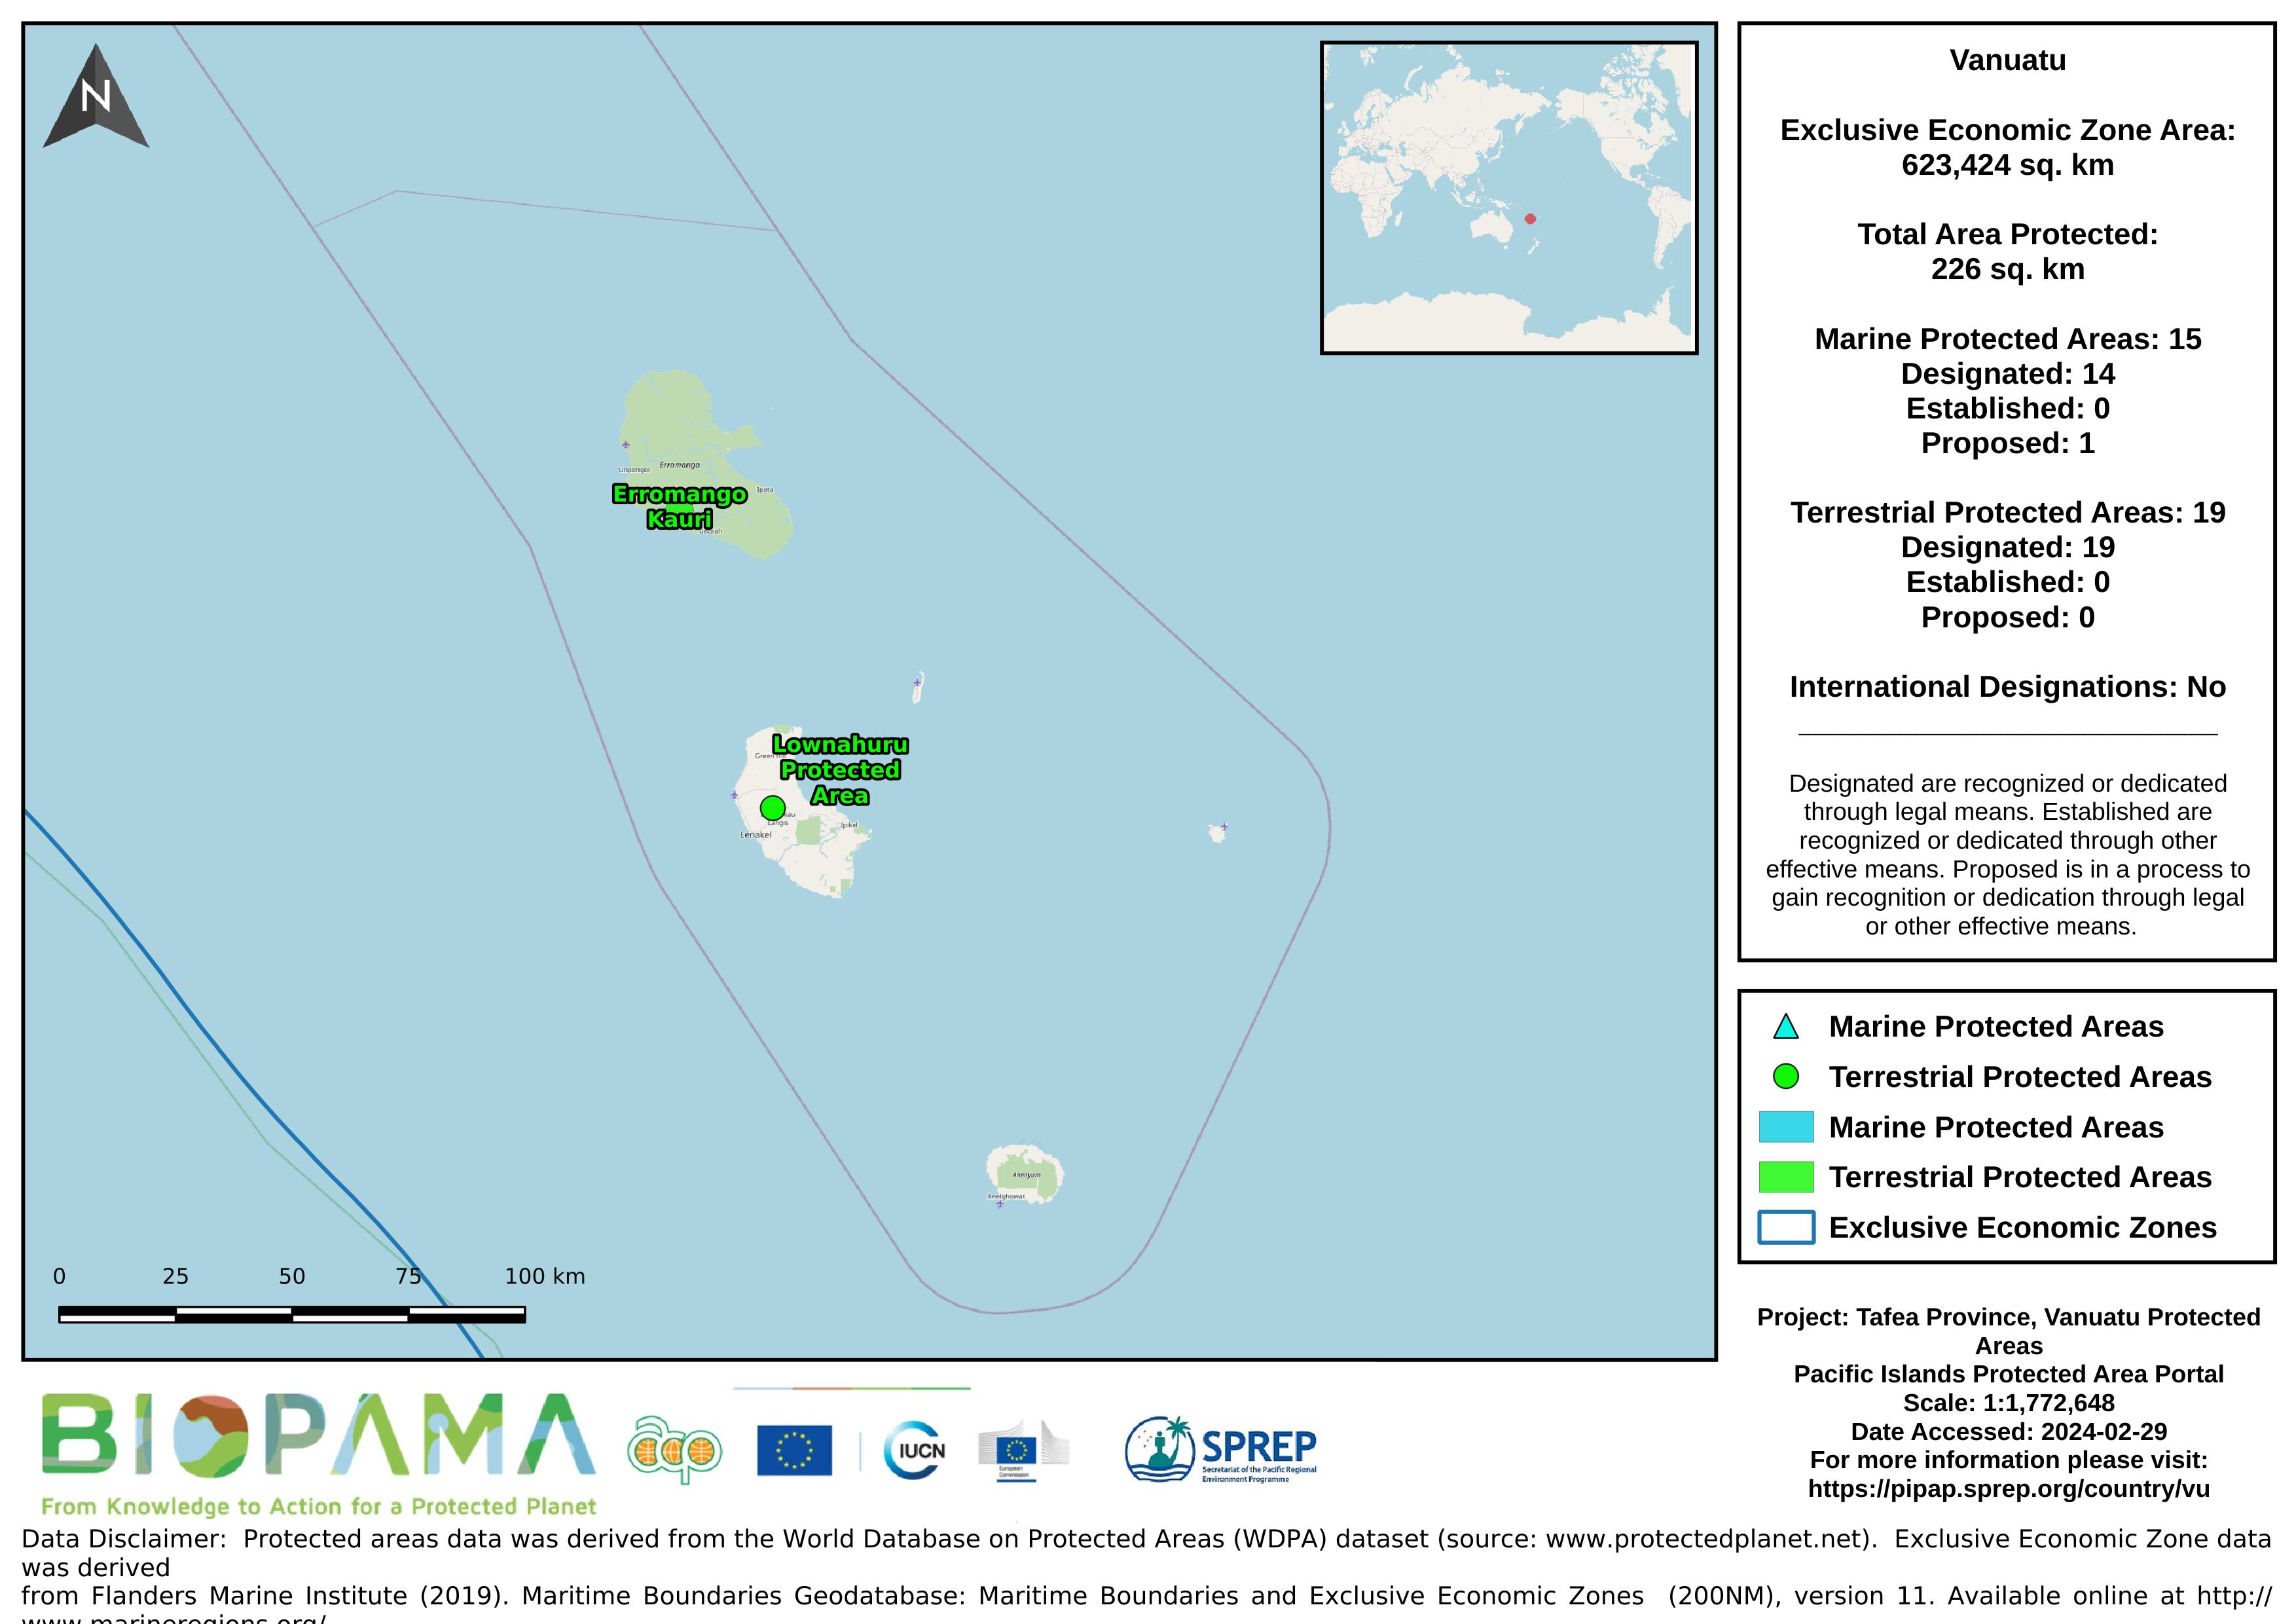
Map of the protected areas for Tafea Province, Vanuatu with country-level summary statistics on the amount of area under protection, count for each type of protected area (terrestrial or marine), and the count of their designation.
Map of the protected areas for Torba Province, Vanuatu with country-level summary statistics on the amount of area under protection, count for each type of protected area (terrestrial or marine), and the count of their designation.
he total economic value of the effects caused by Tropical Cyclone Pam was estimated to be approximately VT 48.6 billion (US$449.4 million). Of this, VT 29.3 billion (US$270.9 million) is attributable to damage, and VT 19.3 billion (US$178.5 million) is attributable to loss. This is equivalent to 64.1% of the gross domestic product (GDP) in Vanuatu, giving an indication of the scale of impact. Because of data limitations, however, it is likely that these figures underestimate the total impact.
*refer to pdf report for more information*
This table provides a summary of the estimated costs for recovery and reconstruction. Total recovery and reconstruction is estimated at VT 34.1 billion (US$316 million). Of this amount VT 10.3 billion (US$95 million) is focused over the short-term (12 months to four years).
*data extracted from the PDNA Cyclone Pam 2015*
For the purpose of this PDNA, the agricultural sector is defined to include the crops, livestock, fishery, and forestry subsectors
Commerce and industry comprises close to 40% of GDP and is therefore a key sector for Vanuatu. Tropical Cyclone Pam damaged the sector’s buildings and inputs for production, and it continued to affect the sector through increased costs of inputs and reduced activity in the economy. It is important to note that the figures reported are likely to be underestimated due to the amount of data available for inclusion within this PDNA, which was prepared in a short time frame.
Vanuatu has obligations under these international conventions and agreements
Metadata file for the GIS data (raster and shapefiles) for the global threats to coral reefs: acidification, future thermal stress, integrated future threats, and past thermal stress.
Metadata file for the GIS data (raster and shapefiles) for the local threats to coral reefs: coastal development, integrated local, marine pollution, overfishing, and watershed pollution.
Excel file with spreadsheets for each species. Downloaded from TREDS May 2021.